
Your eBird checklists inform important bird research, allowing scientists to better understand and conserve birds around the world. This article, written by the Birds Queensland Sunbird Team, describes how eBird data was used to create Queensland, Australia’s first comprehensive, annual account of birds – a valuable tool for identifying changes in bird populations over time.
The Queensland Annual Bird Report – combining eBird data with local expertise, by Birds Queensland Sunbird Team
With almost an identical land area as the contiguous United States, but with only 7% of USA’s population, Australia is a sparsely-populated continent. Indeed it has one of the lowest population densities in the world. Occupying the north-east quarter of the continent, Queensland is the second largest of Australia’s eight states and territories (three times larger than Texas, USA), but it has the highest bird diversity by far. Over 630 species have been recorded in Queensland – about 60 more than the next most species-rich state: New South Wales. It also has more endemics, the majority of which are restricted to the World Heritage-listed Wet Tropics. Yet Queensland’s human population density ranks fifth, so birders are “thin on the ground”.
As well as BirdLife Australia branches across the state, Queensland has its own ornithological society – Birds Queensland – which promotes the scientific study and conservation of birds of the state. Since its inauguration in 1970, the society has published a peer-reviewed journal, called The Sunbird, focused on ornithology in Queensland. Owing to increasing difficulty of attracting submissions, Sunbird’s editorial team decided it was time to introduce an annual report which examined the status of birds across Queensland. The first of these, published earlier this year, is the first comprehensive annual account of the birds of Queensland across its wide variety of tropical, subtropical and arid environments.
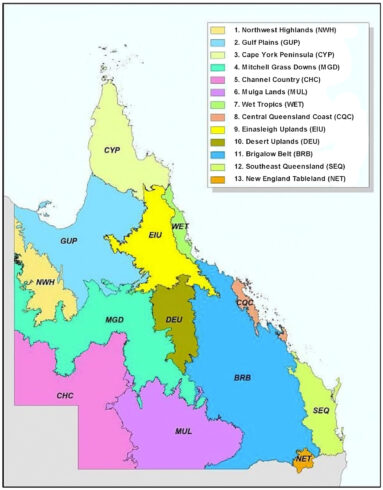
Map showing the thirteen main bioregions in Queensland (we also subdivided CYP and BRB to report from fifteen regions).
To achieve this, the state was sub-divided into 15 nationally recognised bioregions. eBird data for Queensland were downloaded, and then divided between each of the 15 bioregions using R scripts that were written by students at The University of Queensland. After the data for each bioregion was assembled, local bird experts were contacted to scrutinise the data and report noteworthy records, typically of rare or unusual species.
Each bioregion account begins with a description of its geography, climate and protected areas, followed by an annotated list of species with details of the locations and months of observations. At the end of the report, a large matrix summarises the reporting rates of each species for each bioregion, allowing a comparison across the whole of the state.
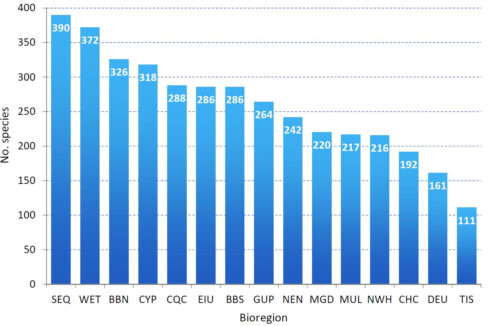
Total number of bird species recorded in each bioregion
During the year reviewed, a total of 571 species were recorded in Queensland. The 41,316 checklists submitted to eBird contained 762,283 individual observations. Some bioregions, especially those with big cities or towns, have a wide coverage of eBird checklists, while others, such as those in the remote areas,have much fewer eBird checklists. Thus the report highlights gaps in the geographical coverage data that can help guide future observer effort.
-
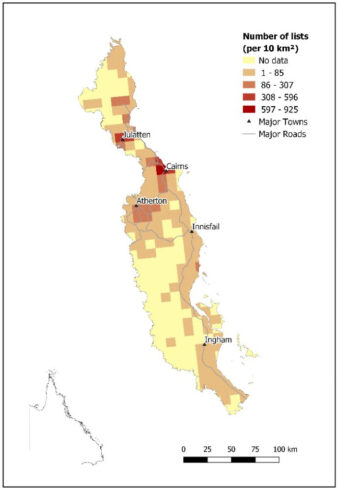
- Map of Wet Tropics Bioregion, showing eBird survey effort

-

- Map of Mulga Country Bioregion, showing eBird survey effort
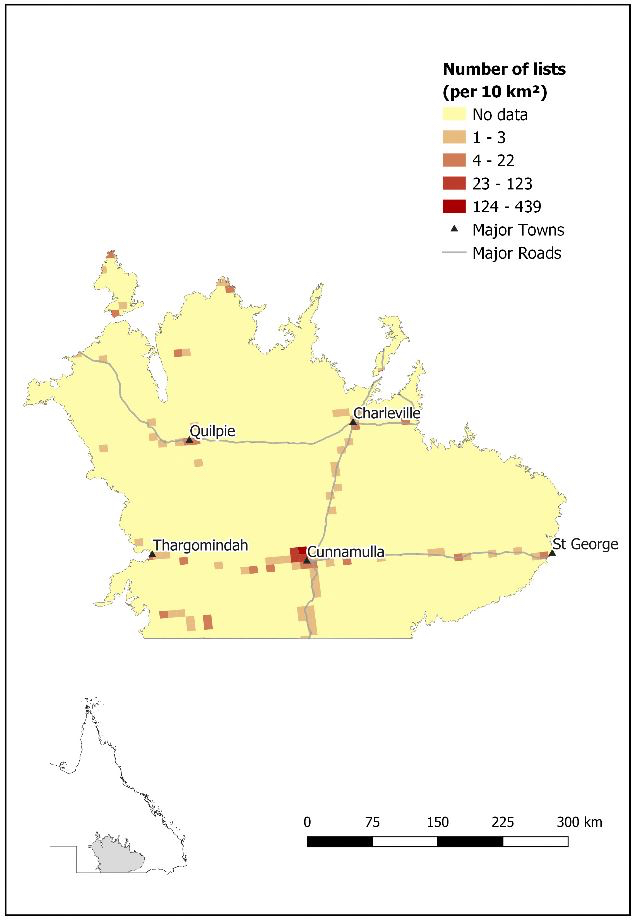
Above, eBird data were combined into regional grids to aid the interpretation. Compare the effort data in the Wet Tropics bioregion (including Cairns) on the left with that of the Mulga Country bioregion in the arid southwest part of the state on the right.
In short, the report presents an overview of Queensland’s avifauna, based on data collected through eBird, and filtered and interpreted by local experts. It promises to be a valuable tool in identifying changes in the avifauna of each region in the future, all based on citizen science data.