
eBird data provides insights into the ‘urbanness’ of Australian birds

A new tool based on eBird data for monitoring the “urbanness” of bird communities reveals that birds have different levels of urbanness.
Restoring urban biodiversity has many benefits (for examples, see here, here, or here), but what should we actually be ‘restoring’? If we restore ‘habitats’, but only Rock Dove (for example) take up residence, is the project truly a success? Many people have relied on species richness as the mainstay for measuring the success of a restoration project, and indeed, this is a critical component of restoration performance. But we anecdotally know that some birds are ‘better’ than others in urban greenspaces – think Superb Fairywrens versus the ubiquitous Noisy Miners. In a global sense, we want to avoid biotic homogenization: i.e., having the same 10 species in urban greenspaces throughout the world. We have proposed a solution to this problem, which uses broad-scale empirical data. Here, we introduce the Urban Greenspace Integrity Index.
The Urban Greenspace Integrity Index (UGII) is a simple, robust, and tractable method to judge whether urban restoration efforts are transitioning towards an improved ecosystem, without the need for a priori reference states. Our method quantifies “improved diversity”, incorporating whether “desired species” re-enter the community. In short, it measures the ‘urbanness’ of a given community. UGII has two fundamental steps: (1) it assigns continental-scale urban scores that are species-specific (see here for more detail); and (2) it collapses these species-specific urban scores to community-level metrics.
It works by first calculating a local-level urban index, based on the species’ urban-scores in a local community – with many samples. The average of the local-level sampling units is then defined as the local-level urban index. As in community ecology, we also define a ‘scaler’ which measures the potential ‘urbanness’ of the species’ pool, and this is the regional urban index. To get the Urban Greenspace Integrity Index, we divide the local-level urban index by the regional-level urban index. Voilá! A measure of a local community’s bird urbanness that is comparable across many regions.
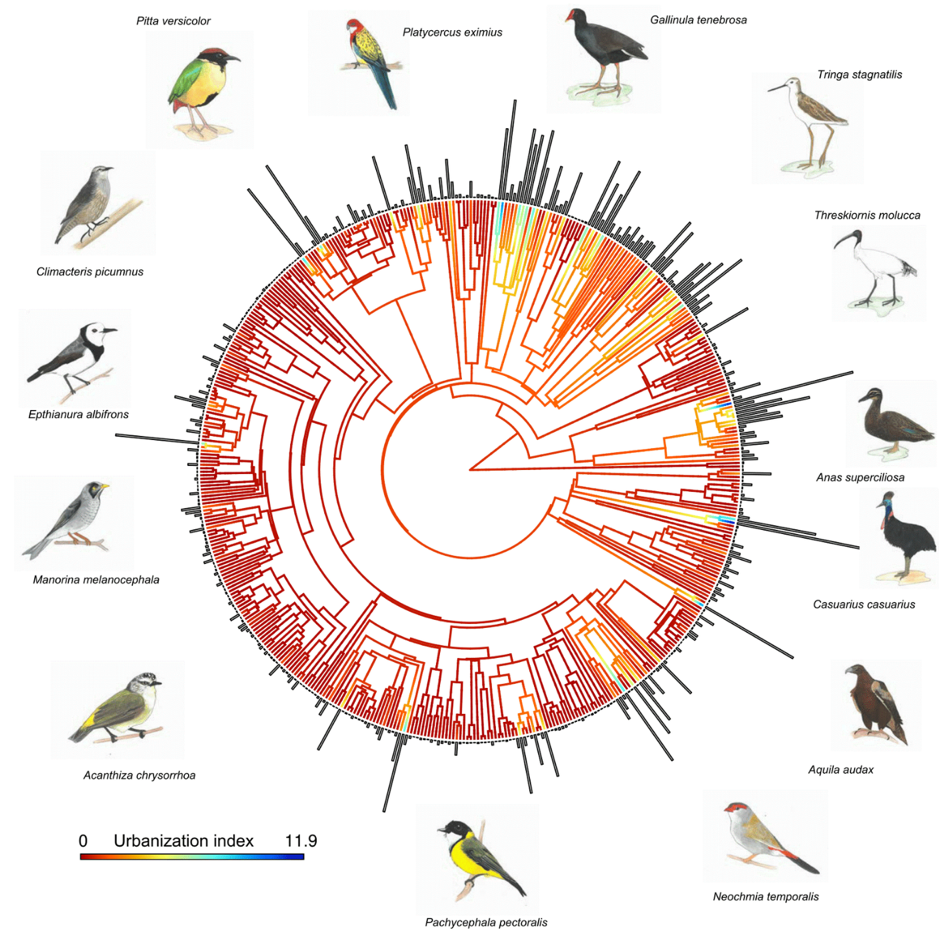
A phylogenetic tree showing how urban species are. The bar and the color shows the level of urbanness of a species. Drawings by Corrine Edwards. An interactive version of this diagram is available here: https://johnwilshire.github.io/bird_urbanness_web_app/
We demonstrated the applicability of the tool using eBird data contributed by many users. We first assigned species-specific urban-scores (explore these here) for all bird species, using night-time lights data. Some example species can be seen in Table 1. Note that some nocturnal species can appear to be ‘more urban’ based on biases in people submitting these species from known roosting sites (but this can be accounted for in models!). We then used ten example urban greenspaces to show that the urban index on an eBird checklist – a distinct sampling unit in the eBird database – was empirically related to the species richness on an eBird checklist. We also found that the urban index on an eBird checklist was empirically related to the distance from the city centre for Melbourne, Brisbane, and Sydney. These results are critical because they confirm that our measure makes intuitive sense in relation to two separate measures of urbanization.
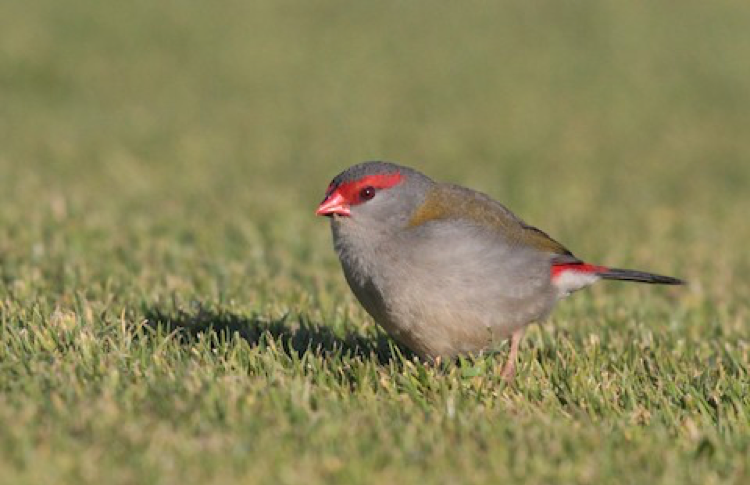
Red-browed Finch Neochmia temporalis © Corey Callaghan Macaulay Library | eBird
Red-browed Finches are birds that could be targeted for restoration by developing urban greenspaces with ample granivore-feeding habitat and resources. Our approach will allow for this to be more easily quantified and monitored.
Table 1: Highest and lowest ranked species according to their urbanness score
| Highest Score (most urban) | Lowest Score (least urban) | |||
| Species | Urban score | Species | Urban score | |
| Laughing Dove | 20.146 | Black-naped Tern | 0.001 | |
| Song Thrush | 14.548 | Black Noddy | 0.001 | |
| Rock Pigeon | 12.49 | Bridled Tern | 0.001 | |
| Powerful Owl | 11.851 | Black-backed Butcherbird | 0.008 | |
| Blue-billed Duck | 11.257 | Black-throated Finch | 0.011 | |
| European Greenfinch | 9.952 | Masked Finch | 0.011 | |
| Spotted Dove | 9.93 | Sandstone Shrikethrush | 0.012 | |
| Common Myna | 9.588 | Gouldian Finch | 0.013 | |
| Tawny Frogmouth | 9.294 | Banded Honeyeater | 0.013 | |
| Dusky Moorhen | 9.19 | White-quilled Rock-Pigeon | 0.013 | |
The Urban Greenspace Integrity index can be used to compare parks, or to measure changes through time to track restoration success. The Index has wide applicability in ecology. With >50% of humans now living in cities and growing pressure for urban consolidation, it’s high time that we up our urban greenspace restoration efforts, and UGII and your eBird observations will help to make these efforts more effective and quantifiable.
More information:
Callaghan, C. T., R. E. Major, M. B. Lyons, J. M. Martin, J. H. Wilshire, R. T. Kingsford, and W. K. Cornwell. 2019. Using citizen science data to define and track restoration targets in urban areas. Journal of Applied Ecology 56(8). DOI: 10.1111/1365-2664.13421
Callaghan, C. T., R. E. Major, J. H. Wilshire, J. M. Martin, R. T. Kingsford, and W. K. Cornwell. 2019. Generalists are the most urban-tolerant birds: an analysis of ecological and life history traits using a novel continuous measure of bird responses to urbanization. Oikos 128(6). DOI: 10.1111/oik.06158