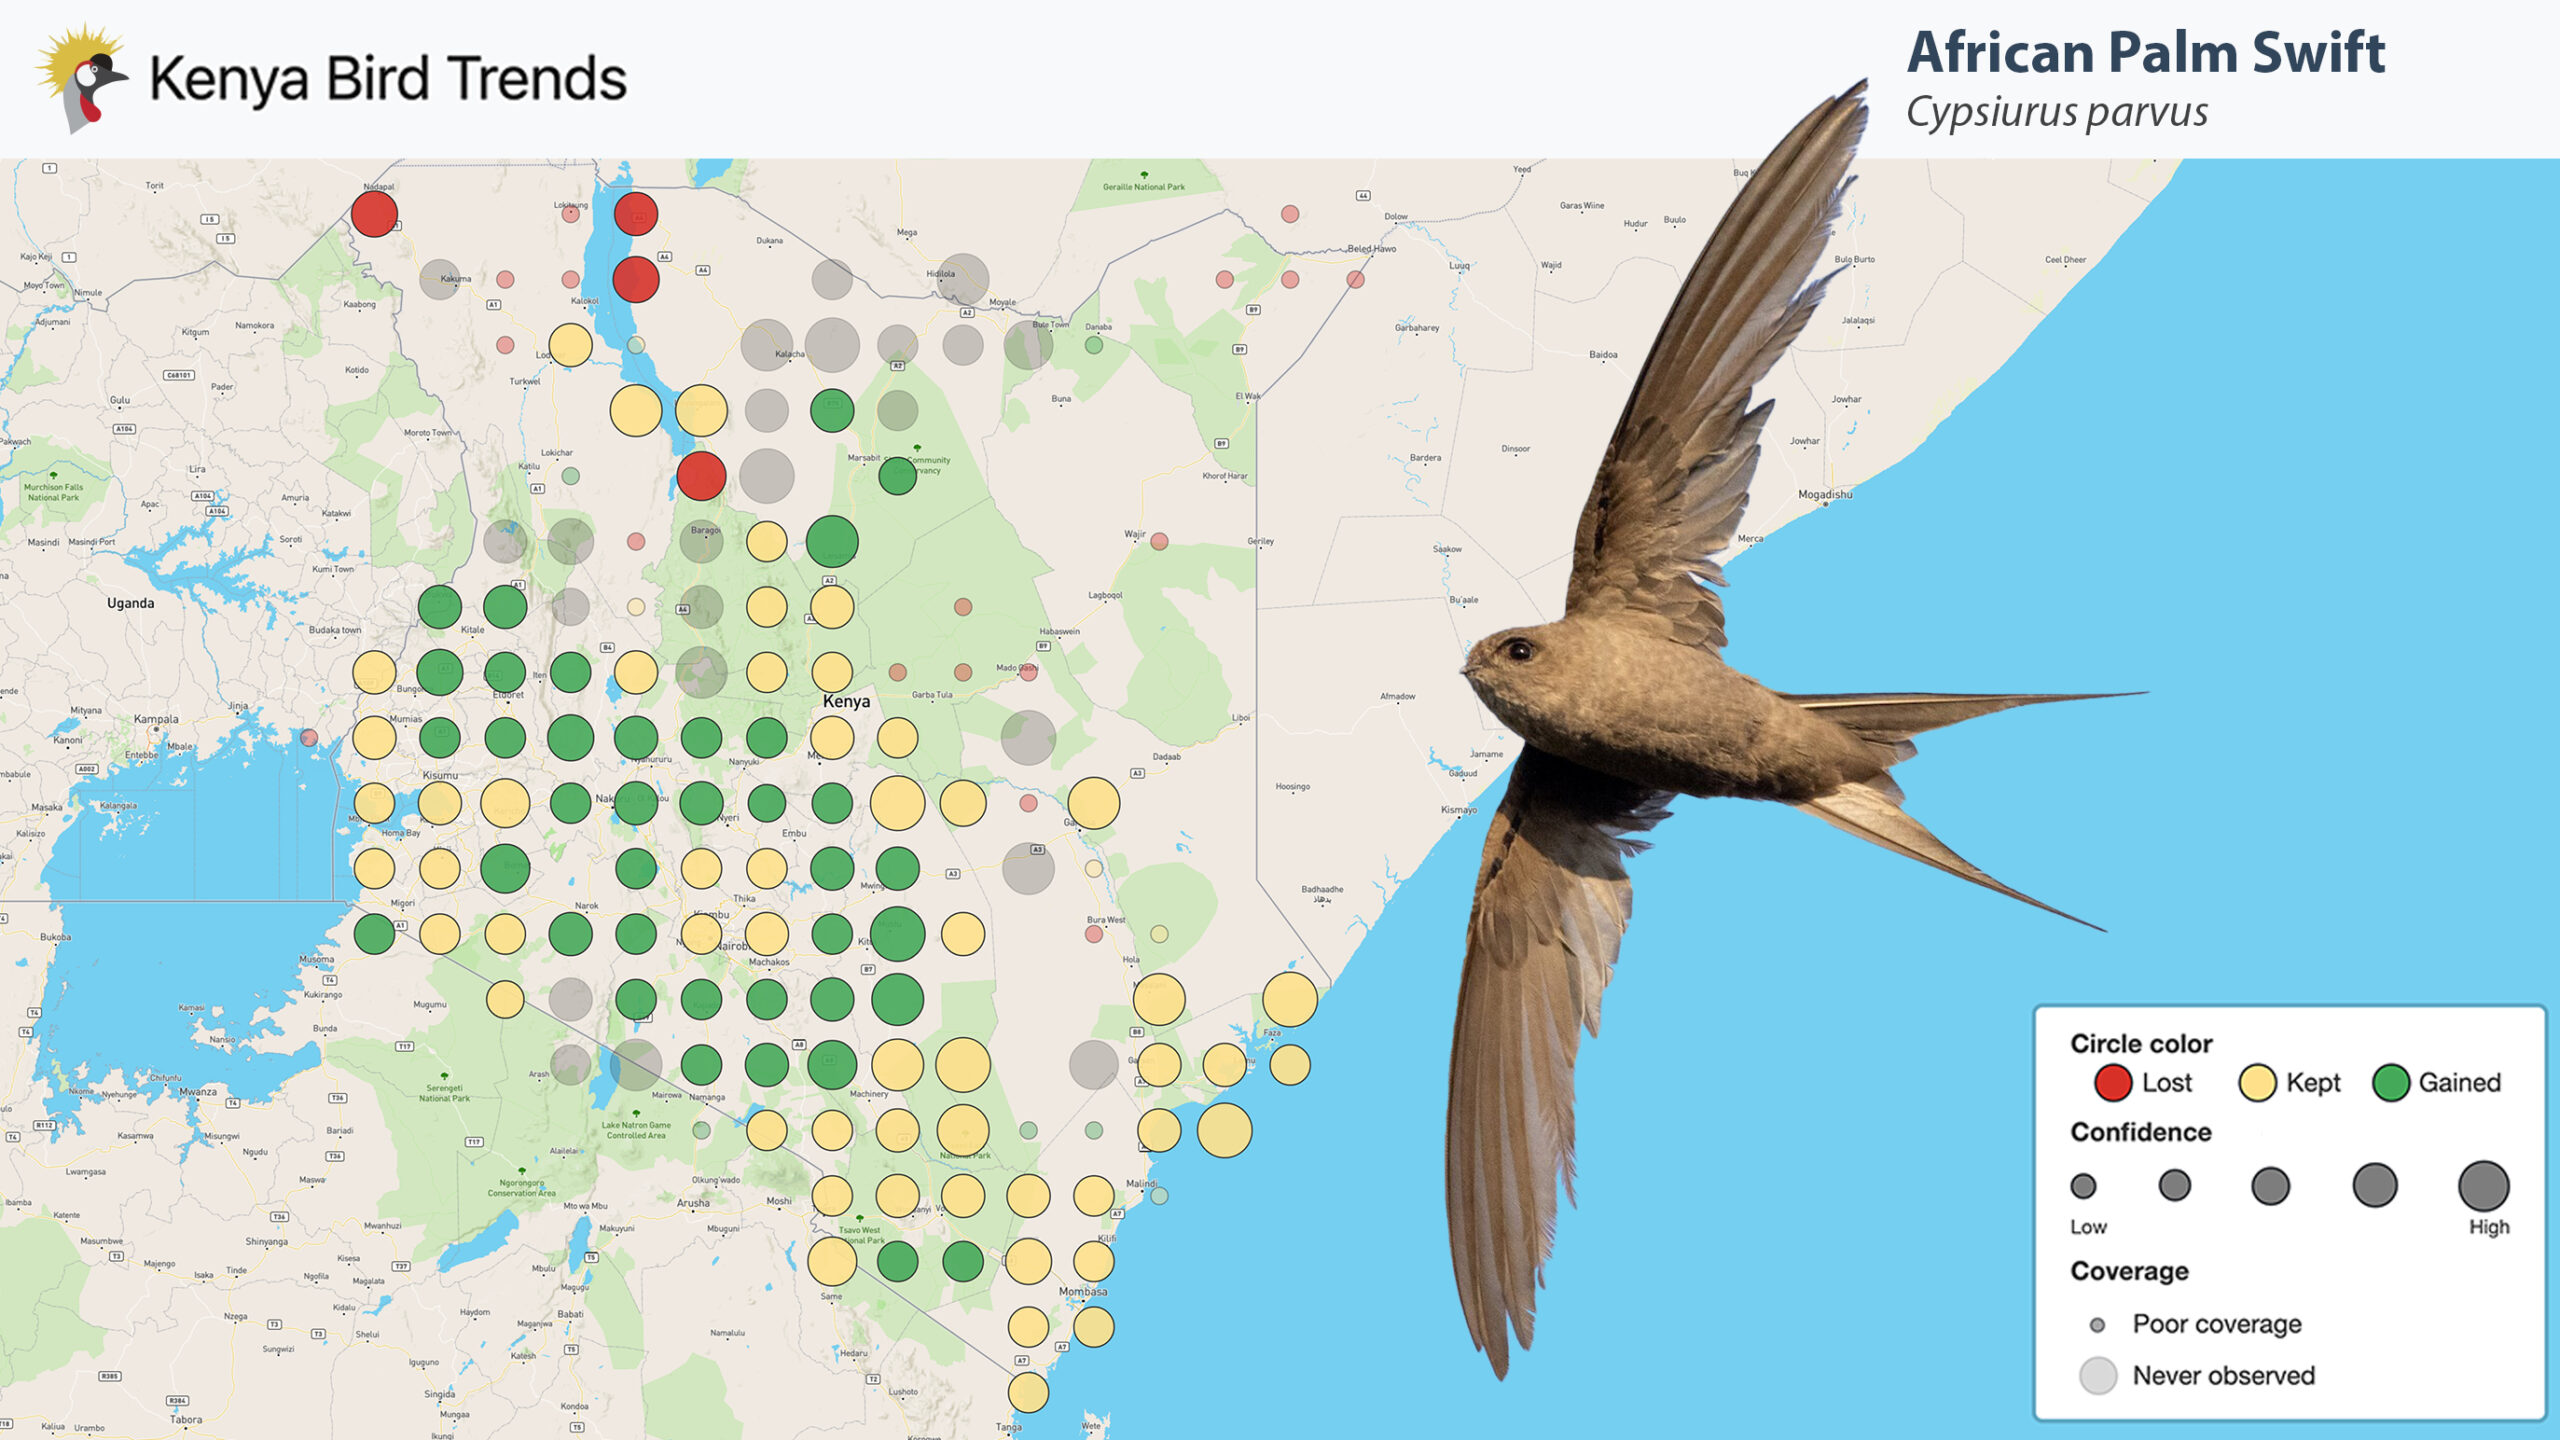
Illustration of the distribution range change of African Palm Swift over the last 50 years. Photo credit: African Palm Swift © Ian Davies / Macaulay Library
A team of Kenyan conservationists used eBird data alongside data from the Kenya Bird Map and a historical bird atlas to map the changes in distribution patterns of all bird species across the country over the past 50 years.
A lot has changed in Kenya since 1970: the total population quintupled and is increasingly urban, temperatures have warmed, forest cover has dropped from 10 to less than 2%, grasslands and wetlands have shrunk while agriculture has spread. These changes modify the landscape and can impact biodiversity in various and complex ways.
As birds are good indicators of ecosystem health, finding out how their distributions have been affected is a good starting point to assess broader environmental changes. Bird atlases are invaluable resources to monitor bird populations, offering insights into long-term and large-scale trends across a wide range of species.

Volunteer efforts by citizen scientists are key to monitoring bird populations. Photo © A Rocha Kenya
Kenya can boast one of the earliest bird atlases on the African continent, offering a baseline against which to measure how birds are doing today. With data collected between 1970 and 1984 by over 200 volunteers, A Bird Atlas of Kenya (Lewis, 1989) mapped the presence and breeding status of 1065 bird species on a grid of 27 x 27 km² squares covering the entire country. The digitized version of this atlas is available on the Global Biodiversity Information Facility (Nussbaumer, 2022).
While this effort has not been repeated recently, we can now leverage citizen science data as a modern, living atlas. Combining data from the two leading citizen science initiatives of the country – the Kenya Bird Map and eBird – and comparing this with data from the historical atlas collected 50 years ago, we found out whether a specific species has appeared, remained or disappeared within each square of the country.
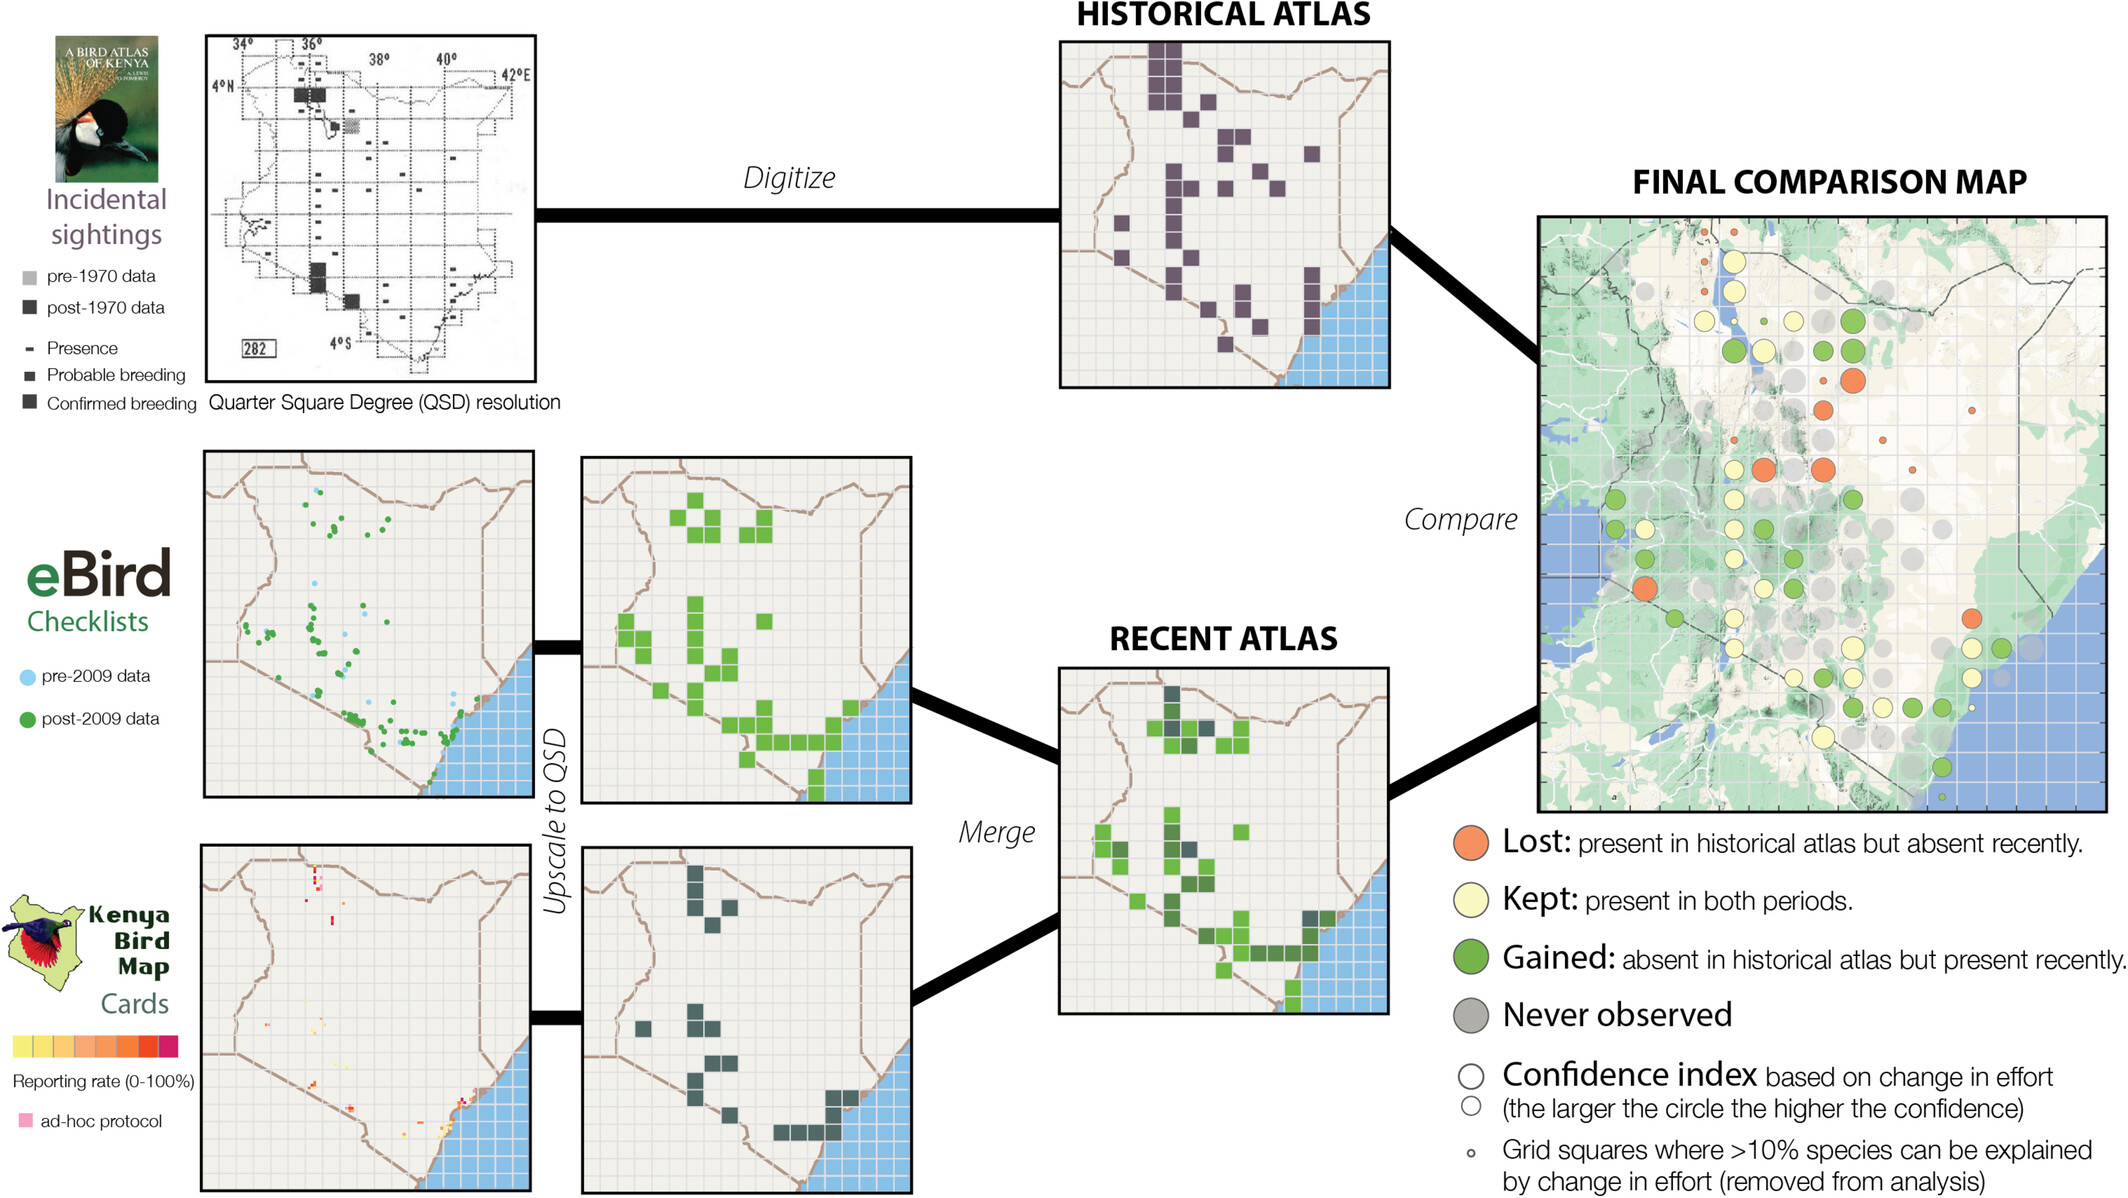
Combining data from the Kenya Bird Map and eBird, and comparing this with data from the historical atlas collected 50 years ago, we found out whether a specific species has appeared, remained or disappeared within each square of the country.
Long-term changes in distribution for each species can be visualized on the public platform kenyabirdtrends.co.ke. Users can browse maps for specific areas or species to learn about how distribution patterns have evolved in the last half-century. The results are also described in further detail in a peer-reviewed scientific article.
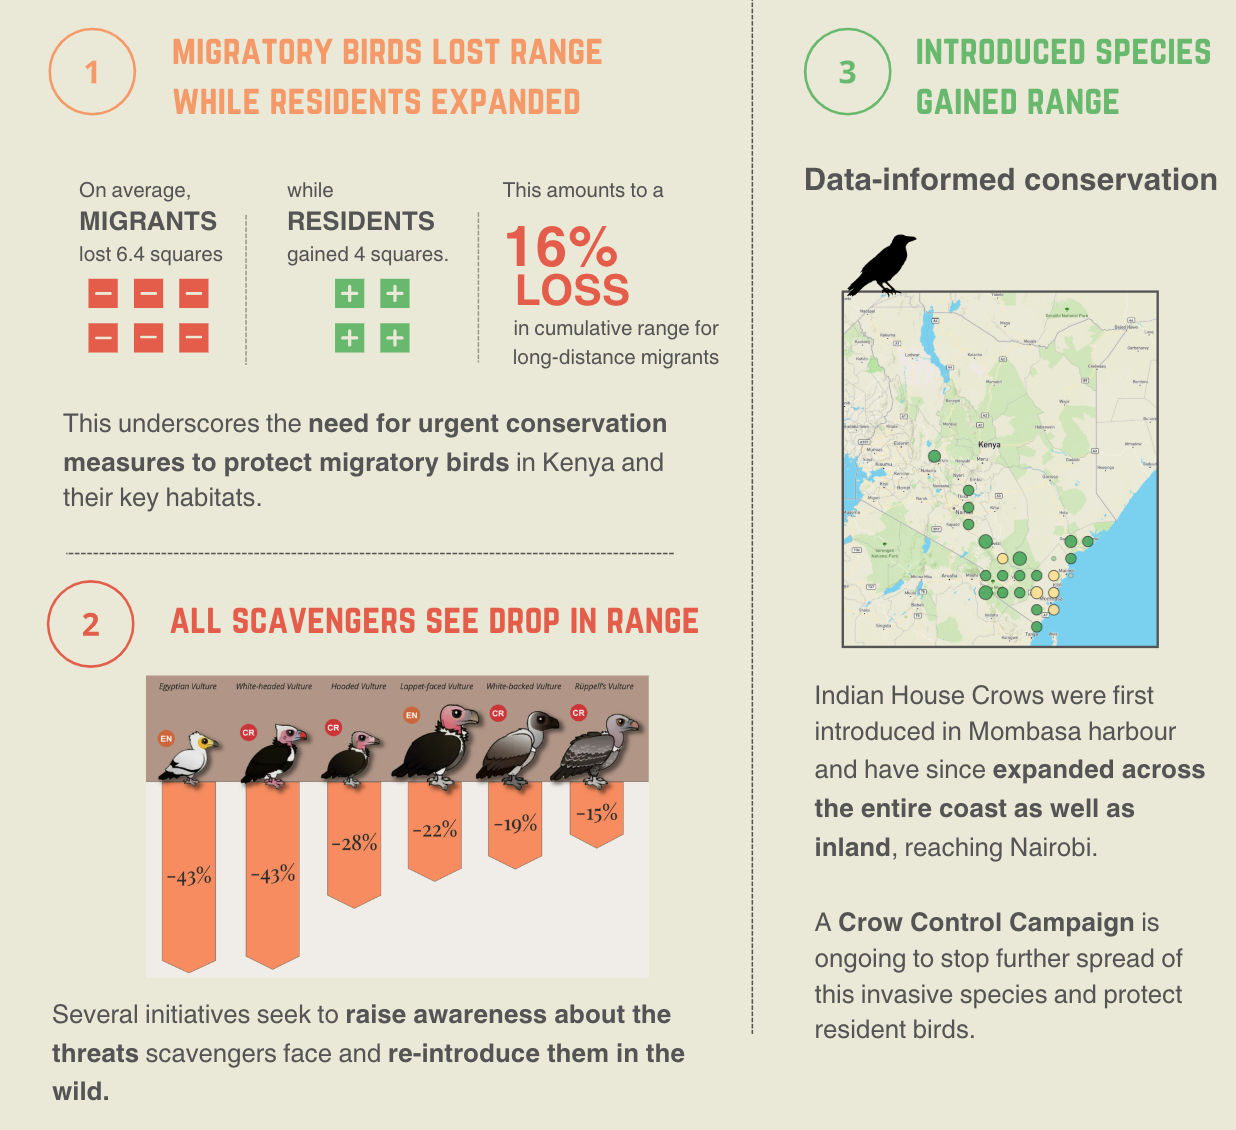
This platform is intended as a tool to inform conservation measures targeting specific areas or species. Sadly it confirmed some worrisome trends that had already been highlighted in other areas of the world, notably a drastic range contraction of all six scavenger species (e.g., Bateleur), and the disproportionate range reduction of Palearctic migrants as compared to their resident counterparts. Conversely, we see the expansion of introduced species such as House Sparrow and House Crow. To limit the disturbance House Crows cause to resident species, a control campaign is currently ongoing to limit the spread of this species further inland.
This initiative demonstrates the power of citizen science data such as eBird to learn about ecosystem changes and create engaging tools for conservation. The platform launch served as an opportunity to raise broad public awareness about bird trends in Kenya and the importance of citizen science, with mainstream media coverage and a wide promotion campaign across many of the country’s leading conservation agencies.
All this was possible thanks to the thousands of eBirders in Kenya and the work of eBird reviewers to ensure the quality of the data – a total of 91 000 checklists were considered in the analysis, submitted by close to 4 000 observers!
This analysis has also shown that citizen science data is still concentrated in certain parts of the country (cities and national parks mainly), while other vast areas, such as the north east, are still missing data. So eBirders are encouraged to go explore those lesser birded areas and submit data that would be highly valuable from a scientific and conservation perspective.
Key partners: Kenya Bird Map, Tropical Biology Association, A Rocha Kenya, the National Museums of Kenya, and Kenya Bird of Prey Trust, with financial support from the UK Government through Darwin Initiative.
 |
 |
 |
 |
 |
Reference:
Nussbaumer, R., Nussbaumer, A., Guchu, S., Hatfield, R.S., M. Kanga, E., Kung’u, G.N., Kuria, A., Miller, E., Ndang’ang’a, P.K., Njoroge, P., Ogada, D., Shema, S. and Jackson, C. (2024), Historical Bird Atlas and Contemporary Citizen Science Data Reveal Long-Term Changes in Geographic Range of Kenyan Birds. Divers Distrib e13935. https://doi.org/10.1111/ddi.13935

