
Image: Black-Throated Blue Warbler © Ryan Justice, Macaulay Library / Recording: Black-Throated Blue Warbler © Bob McGuire, Macaulay Library
The Macaulay Library hosts the world’s largest archive of digital audio of birds with nearly 2.4 million sound recordings. To easily identify and navigate the multitude of recordings in the archive, we use spectrograms, visual representations of the intensity of sound frequencies across time. Spectrograms allow us to compare recordings by sight, which can be more efficient and precise than by sound alone. Spectrograms are used by bioacoustics scientists who want to analyze sounds, by Merlin Sound ID to offer identification suggestions, and by anyone wanting to learn more about sounds. After more than a decade of using the same spectrograms, the Macaulay Library team is excited to share an update to our spectrograms designed to enhance both their visual appeal and functionality!
Media Search and individual media pages are now using the new spectrograms, and other views, such as checklists and trip reports, will start using them in the coming weeks. We improved our spectrograms in the following ways:
Longer recording support. Macaulay Library spectrograms no longer have a length cutoff, allowing us to display very long recordings. As passive acoustic monitoring becomes more and more common, these long recordings are important for our research and conservation goals and improving sound ID.
Long recordings like this 13 minute Carolina Wren song sequence are now easier to explore.
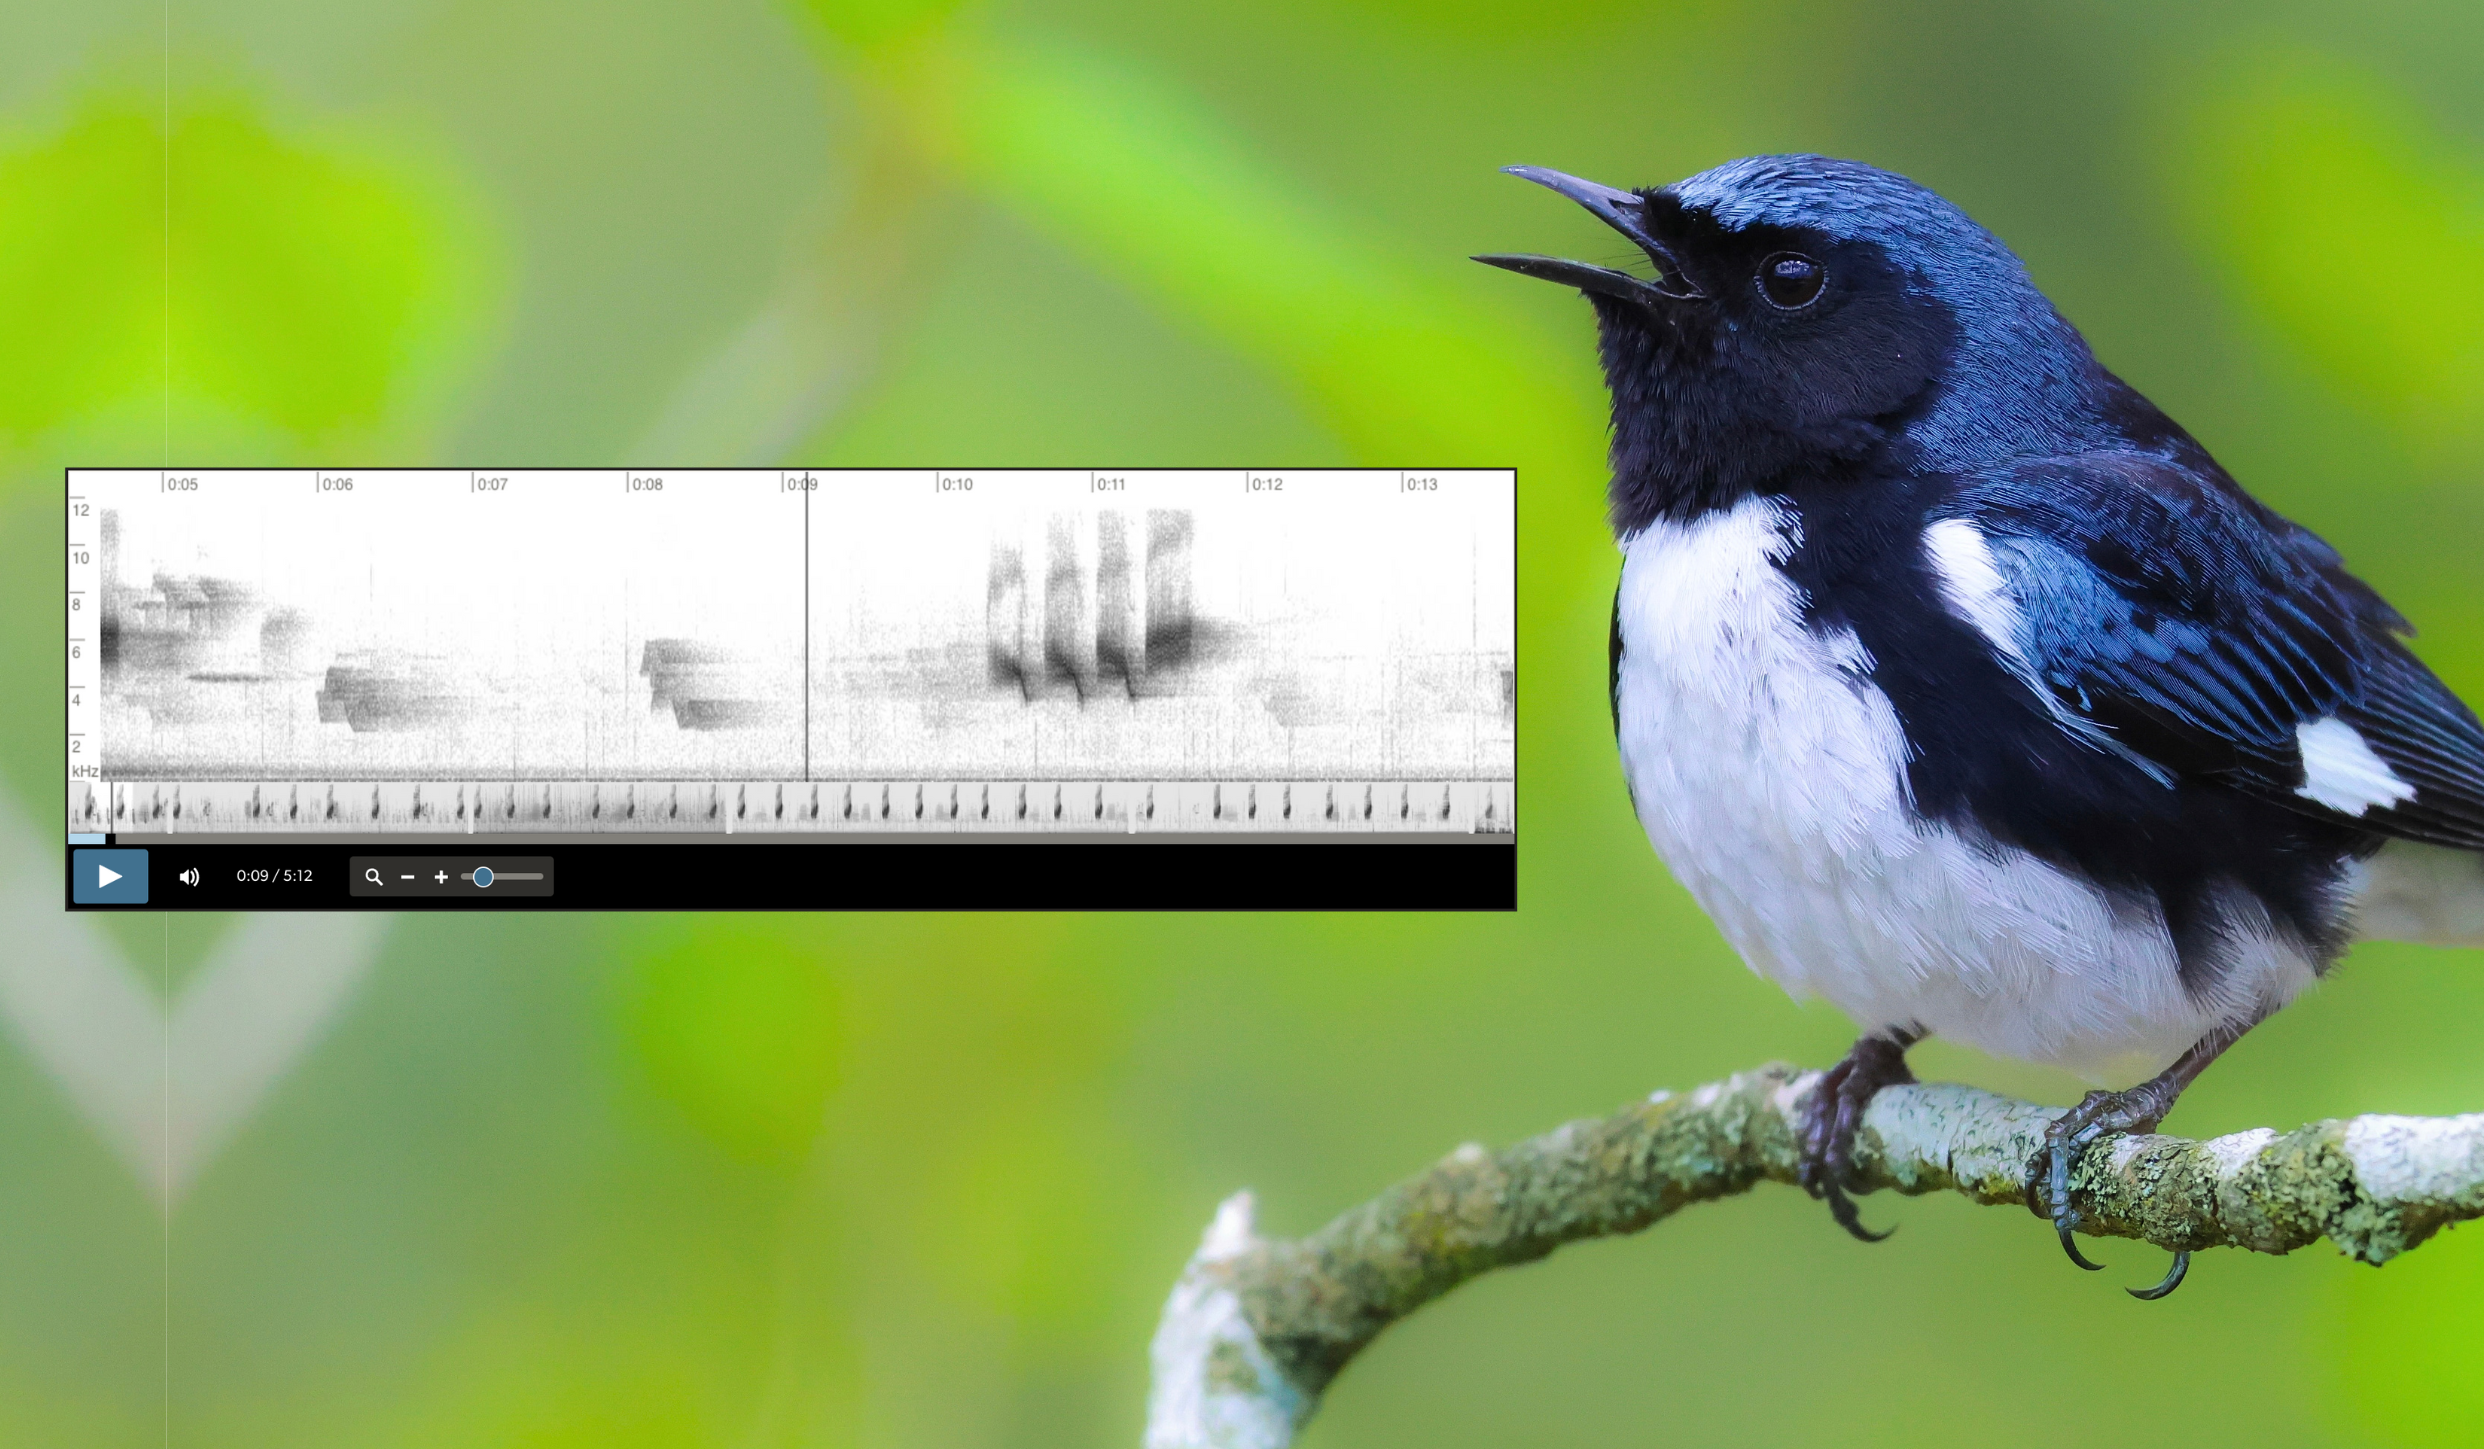
Better resolution. We’ve adjusted the spectrogram settings to allow better visualization of quieter background sounds, as well as sharper-looking focal sounds and a much more detailed “timeline” preview below the main spectrogram.
Better visibility. Changes have been made to the default zoom on the spectrograms. Previews in Media Search now show 10 seconds so you can get a better idea of what’s in a recording at a glance, and once you play the audio, more of the recording is visible at once. But now that the spectrograms are higher resolution, you can also zoom in to see more detail—or zoom out to get a birds-eye view.
Higher frequencies. We’re now showing frequencies up to 12kHz. While most bird sounds occur below the previous limit of 10kHz, many sounds go above that point and are useful to see. Expanding up to 12kHz will allow more of the bird’s sound to be visible.
The high-pitched song of a Costa’s Hummingbird looks much more complete with the new settings.
Data efficiency. Spectrograms are now composed of multiple smaller images, so loading the recording to listen to it should be more efficient than before.
Accessibility. Lots of behind-the-scenes settings have been adjusted to make sure the maximum number of users are able to see and listen to the amazing sounds of birds and other animals.
Spectrograms are a vital tool for anyone interested in the study of bird vocalizations. We invite you to explore the updated spectrograms in the Macaulay Library. Whether you’re a seasoned ornithologist or a curious birder, these new features are designed to make your exploration of bird sounds more informative and enjoyable.