


Results for Eastern Bluebird already reflect a grand conservation success story for this once-troubled species.
Want to know in what survey blocks species have been found as Possible, Probable, or Confirmed? Where, when, and by whom the species was seen? How a species’ distribution compares between this Atlas and the first conducted 20 years ago? This article helps you navigate the interactive range maps now available to answer such questions.
GETTING STARTED
The species maps can be found on the Explore Data tab as shown below or directly by clicking here. Note these are atlas-specific maps showing only bird records entered via the Atlas eBird portal. If you don’t see your observation on a map, you may have entered it into the wrong portal. Learn more here.

This will default to the following view:

Start by entering the species name in the field at upper left. You can enter all or part of the species name, or the 4-letter alpha code if you know it. The default date setting is to show all WBBA II data for that species but this can be adjusted to select months or WBBA I using the dropdown box as desired.

The “Location” field at upper right functions as a quick zoom tool and can be left blank. If desired, however, type a city, county, or other natural feature and choose the most applicable from the suggested list. Otherwise, you can zoom in and out as you would with any other online mapping feature by clicking twice on the map to zoom in or using the plus/minus symbols on the left side of the screen. You can also use the “Zoom Tool” feature at upper right of the screen to draw a box around the area you wish to zoom to. Zooming out to the “Full Species Range” is also available there.

The right panel also allows you to toggle between satellite and street views, explore only those records that include photos, audio, or video, and display individual observation points at broader map scales.
MAP EXAMPLE
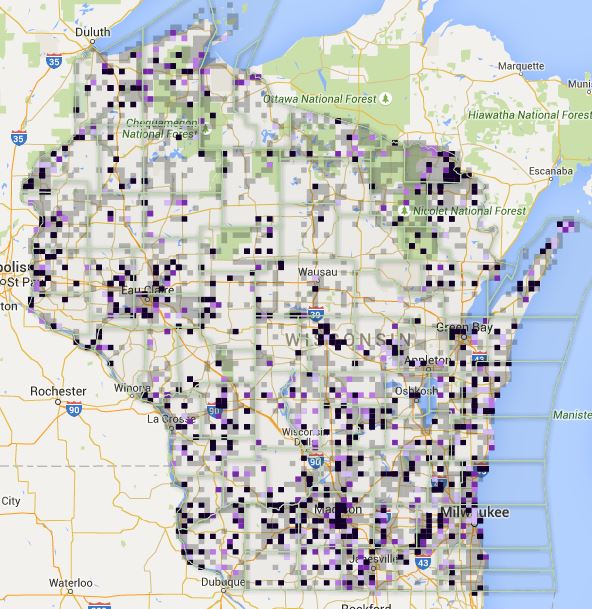
Let’s take a look at an example. Here is the WBBA II map for Wild Turkey, keeping in mind this is just for the 2015 field season so far. As indicated by the key at lower right, the level of breeding evidence is reflected by the color of the block, with darker colors yielding higher evidence, i.e. black is Confirmed, dark purple is Probable, light purple is Possible, and the lightest pink is simply Observed (seen, but no Atlas code). Details of these breeding codes are here. Note that gray blocks show there was some level of survey effort there but the species was not detected, whereas blank space shows no survey effort and thus no data on presence/absence of the species. The latter is a good explanation for the few turkey observations across north-central Wisconsin so far.

Wild Turkey WBBA II
COMPARING MAPS BETWEEN WBBA I AND WBBA II
Now let’s say you wanted to compare this statewide turkey distribution to that found during the first Atlas conducted from 1995 to 2000. Simply go up to the Date field and change “WBBA II” to “WBBA I”. The result is here. Wow, the species certainly has taken over the north!

Wild Turkey WBBA I
(Note: We do not currently have the ability to show WBBA I and WBBA II results on the same graphic, so to view the maps simultaneously simply start with one of them, copy the website address, paste it in a new tab or window in your browser, and then change the date to the opposite of your original map.)
The same procedure can be used for any species to see how their range has shifted, expanded, or contracted in the past two decades, keeping in mind that WBBA II has only one field season completed so far versus six field seasons completed in WBBA I.
DIGGING DEEPER TO LOCAL SCALES
In addition to the broad, statewide maps you can also zoom in to individual blocks or groups of blocks to see details of observations made in that area. This will turn the colored blocks into more precise balloon markers that are color- and letter-coded to show the highest level of breeding evidence at each plotted location. Click on each marker to see a list all observations of the species in that location, and then within that list click on the “Checklist” link to see the full checklist page for that visit, which shows details such as who, where, when, other species found, descriptive comments, and any embedded media.

The species maps are a wonderful way to see Atlas data nearly in real-time, get a sense for how species distributions may be changing, and explore who’s seeing what in your neck of the woods. And in the long run these maps will serve as a primary tool for understanding and conserving our breeding bird populations. If you have additional tips for navigating map outputs or suggestions for how they could be improved, drop us a line at atlas@wsobirds.org.