
Nature is wondrous and one of the most fascinating phenomena in nature is migration. Twice a year birds embark on perilous journeys crossing mountains, deserts, and oceans, sometimes traveling more than 3,000 miles each way. Even tiny birds weighing less than a nickel, such as Ruby-throated Hummingbirds, cross the Gulf of Mexico to and from their wintering grounds every year.
The mystery of why birds migrate has mostly been solved, but that doesn’t make it any less mysterious because migration is hard to see. Humans don’t get a bird’s-eye view of migration; we can’t see birds moving from the Andes in Colombia to the boreal forests in Canada. We know birds migrate, but we don’t always know the paths they take. And “those paths are critical for bird conservation,” says Emily Cohen, assistant professor at the University of Maryland Center for Environmental Science where she studies migratory connectivity.
The challenge for ornithologists has been to understand those migratory pathways.
Ana Gonzalez, a postdoctoral student at Simon Fraser University, studies Canada Warblers on their wintering grounds in Colombia. Gonzalez captured a Canada Warbler at one of her study sites, affixed a tiny numbered leg band on him, and sent the Canada Warbler she nicknamed “Arturito” on his merry way. She also took a feather to examine chemical signatures called stable isotopes that scientists use to determine the general area where a bird spent the summer. Stable isotope signatures revealed that Arturito, weighing in at less than a AAA battery, flew somewhere within the central and eastern Canadian provinces to breed and returned to the exact same spot in the fall where Ana’s team recaptured him.
Gonzalez’s study unlocked part of Arturito’s journey providing details about where an individual spent the breeding and wintering months, but to understand migration patterns at a larger scale for entire populations, we need more data. Which path does Arturito and the rest of the Canada Warblers take when they fly to Canada? And when do they arrive at certain stops along the way?
Bird watchers, it turns out, can help answer those questions. eBird, a program at the Cornell Lab of Ornithology, is the largest citizen science project in the world. eBird has been collecting observations of birds reported by bird watchers around the world for more than 15 years. eBird now contains more than 750 million observations of birds. “Those observations provide a whole new way of seeing biodiversity,” says Steve Kelling, co-director of the center for Avian Population Studies at the Cornell Lab of Ornithology.
The eBird Science team combined observations for 610 species in North America submitted by 179,297 bird watchers with satellite imagery from NASA, NOAA, and the USGS to create animated migration and seasonal abundance maps.
The results are spectacular.
For the first time we can watch migration happen at the scale of continents for more than just a few species. Previously what we knew about migration came from single individuals carrying a transmitter or a numbered leg band like Arturito. “Before, it was like a black box,” says Cohen. “For the first time we can see movements of entire populations, not just individuals,” says Kelling. Knowing all the points where and when a bird occurs, is what scientists call the annual cycle, an aspect that was previously difficult to pinpoint for more than a few individual birds.
Watch the journey of Barn Swallows, a bird found darting over fields and lakes, from South America to Canada. The detail and information in the animations is breathtaking. Not only can we see how Barn Swallows move, we can see where they are most common, and we can see a population in South America that migrates from Argentina to Venezuela and back.
But to paint the most complete picture of bird abundance, the eBird Science team needed to fill in the gaps—the places where bird watchers didn’t go. “To fill the gaps,” Alison Johnston, research associate at the Cornell Lab who worked on the models, says, “we linked observations of birds to habitat data from satellite imagery. This allowed us to characterize the numbers of birds in different environments and to use this to make predictions to nearby places without data.” For every species, the team carefully tested the data and only made predictions if their models produced reliable results.
All of that number crunching and checking goes into creating what Johnston calls, “transformative products,” taking raw eBird data about when and where people report birds and turning it into something even more powerful.
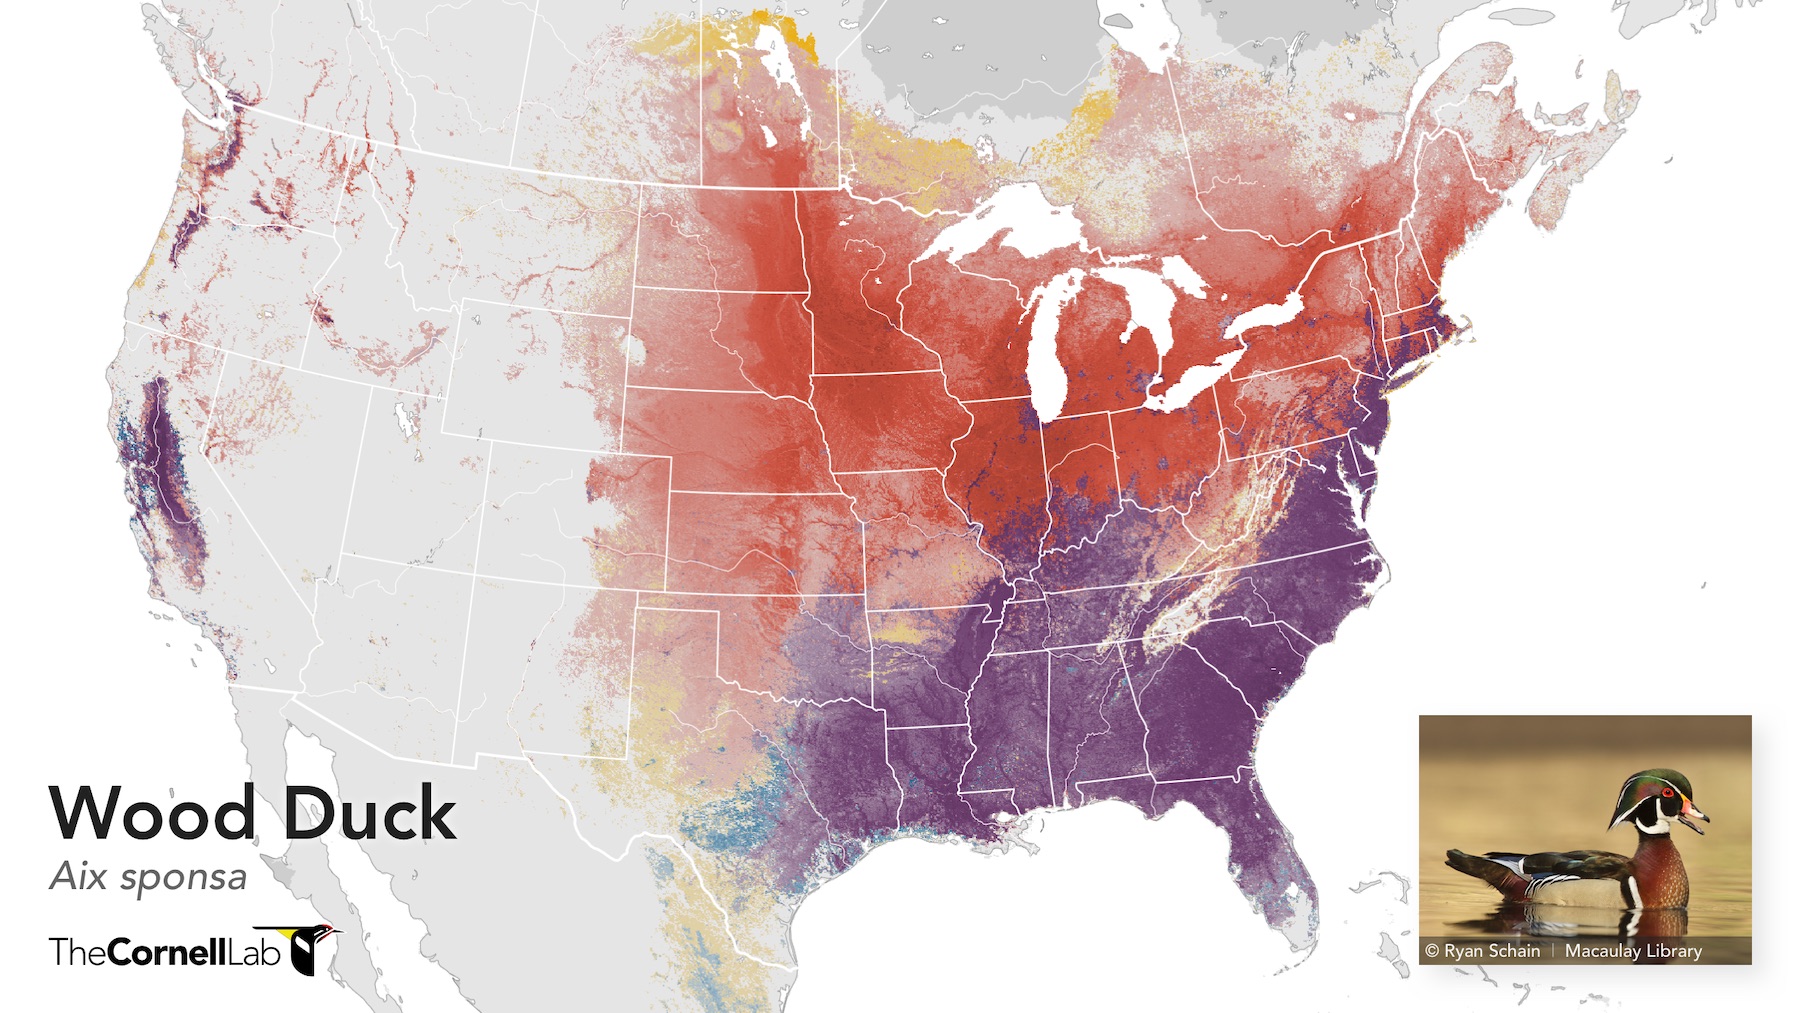
The new data products are more than just mesmerizing migration maps, “Now, we not only have an idea of where to find a bird, but where that bird is most abundant as well,” says Kelling. Take a look at how waterfowl in North America move across the landscape. The paths waterfowl take across North America are observable like never before while highlighting locations where waterfowl are most abundant. In the winter months the Mississippi River Valley hosts thousands of waterfowl and during spring and fall migration the Prairie Pothole region in North and South Dakota lights up with large concentrations of waterfowl. These dynamic maps highlight exactly where and when waterfowl turn up to help conservationists better protect those species.
“eBird Science also shows the power of people working together,” says Chris Wood, eBird Project Leader. “It’s amazing; all of this began with people recording what they saw in notebooks and now on smartphones,” and now, says Wood, “we can see the speed of migration of a Canada Warbler moving from the Colombian Andes where they are concentrated to a broad area across the U.S. and Canada—all from observations of bird watchers.”
“The detailed information coming from observations submitted by bird watchers around the world is a game changer,” says Amanda Rodewald, Garvin Professor and co-director of the Center for Avian Population Studies at the Cornell Lab. “These new data products show the distribution and abundance of species at weekly intervals. Information at such fine spatial and temporal scales helps guide more flexible conservation solutions that can readily accommodate human and ecological needs.” For example, Rodewald explains, “if we know precisely when and where birds are nesting in hayfields, we can design conservation interventions—like postponing mowing—to help birds while minimizing impacts to farmers.” Leveraging fine-scale data from eBird Science, Rodewald says, “gives us more options to conserve species while accommodating human needs.”
The eBird Science data products are publicly available for researchers, educators, and conservationists to use to better inform conservation actions. Cohen, for example, used the publicly accessible eBird Science data products to map where and when birds stop in the southern Appalachian Mountains alongside proposed wind farm developments to determine if potential conflicts existed. Karla Guyn, chief executive officer at Ducks Unlimited Canada, used the animations to highlight the importance of doing conservation work across the entire length of a bird’s migratory path.
Contributions from nearly 180,000 people helped build an unparalleled window into the full annual cycle of bird populations in the Americas that will help us better understand and prevent avian population declines. “Rangewide maps of where and when species occur during their annual cycle are really fundamental to nearly every part of a bird’s biology from climate niches to habitat affiliations to species interactions,” says Cohen. As a growing number of bird watchers report what they see, their observations will fuel eBird Science and help build global models of bird movements and abundance.
~~~
Your observations can help expand what we know about the annual life cycle of birds and help guide conservation actions. Now is a great time to get started sharing your observations for science. The 2020 Great Backyard Bird Count begins February 14 and continues through February 17. Sign up at eBird.org, go birding for fun, and contribute to science and conservation.
~~~
The new data-driven maps and animations are made possible through support from the National Science Foundation, Wolf Creek Charitable Foundation, Leon Levy Foundation, NASA, Amazon Web Services, and Institute for Computational Sustainability.