The eBird team recently updated their ‘Science’ tab with new models depicting movements, distribution, and abundance patterns for 179 new species, including 10 New Zealand species. These models offer a bird’s-eye view of avian movements and are all produced using eBirders observations. They reveal the power of your personal observations to science and conservation, transforming the global birding community’s passion for birds into a powerful resource for research, conservation, and education. The team compiles raw eBird data (the when and where people report birds) and high-resolution satellite imagery from NASA, NOAA, and USGS into cutting-edge statistical models to predict when, where, and in what numbers species occur every week of the year.
The team produced three types of visualisations, abundance animations, abundance maps and range maps. Abundance animations represent weekly relative abundances, revealing movements of a population throughout the year. They are certainly the most captivating as they reveal movements over the course of the year. Four of the NZ species now have animations; Tui, Wrybill, Shining Cuckoo and Banded Dotterel. These abundance animations reveal predictions of where birds are spending the winter as well as giving indications as to when they start to move into certain areas throughout the year. The maps are produced using refined cutting-edge statistical models and machine learning techniques to visualize distribution and abundance patterns for the species. The animations reveal patterns that aren’t necessarily visible, and are sometimes very difficult to study, in the field, and so can be very useful for generating new hypotheses and fuelling more research.
Where is the data from?
The ability to update and improve the Status and Trends products in the future continues to depend on the contributions of eBirders like you! If you submitted checklists that meet all the requirements answered under “How do I contribute?” below, then you have already contributed data to the Status and Trends! Any future checklists you submit that meet these requirements will automatically be included in analyses for future updates to Status and Trends products.
Remember, any observation is useful, whether it is from today or your field notebooks from 15 years ago. Whether it is from a hotspot with amazing birds, or a place with few species – all checklists are valuable. For Atlasers using eBird we hope that these maps can help show how valuable their data is and knowing that their observations are in there and contributing towards national-scale knowledge on species. For those birders who have many old notebooks sitting on a shelf somewhere, we strongly encourage you to consider entering that historical data as it is immensely valuable. Read David Lawrie’s story about his journey getting all his old data into eBird.
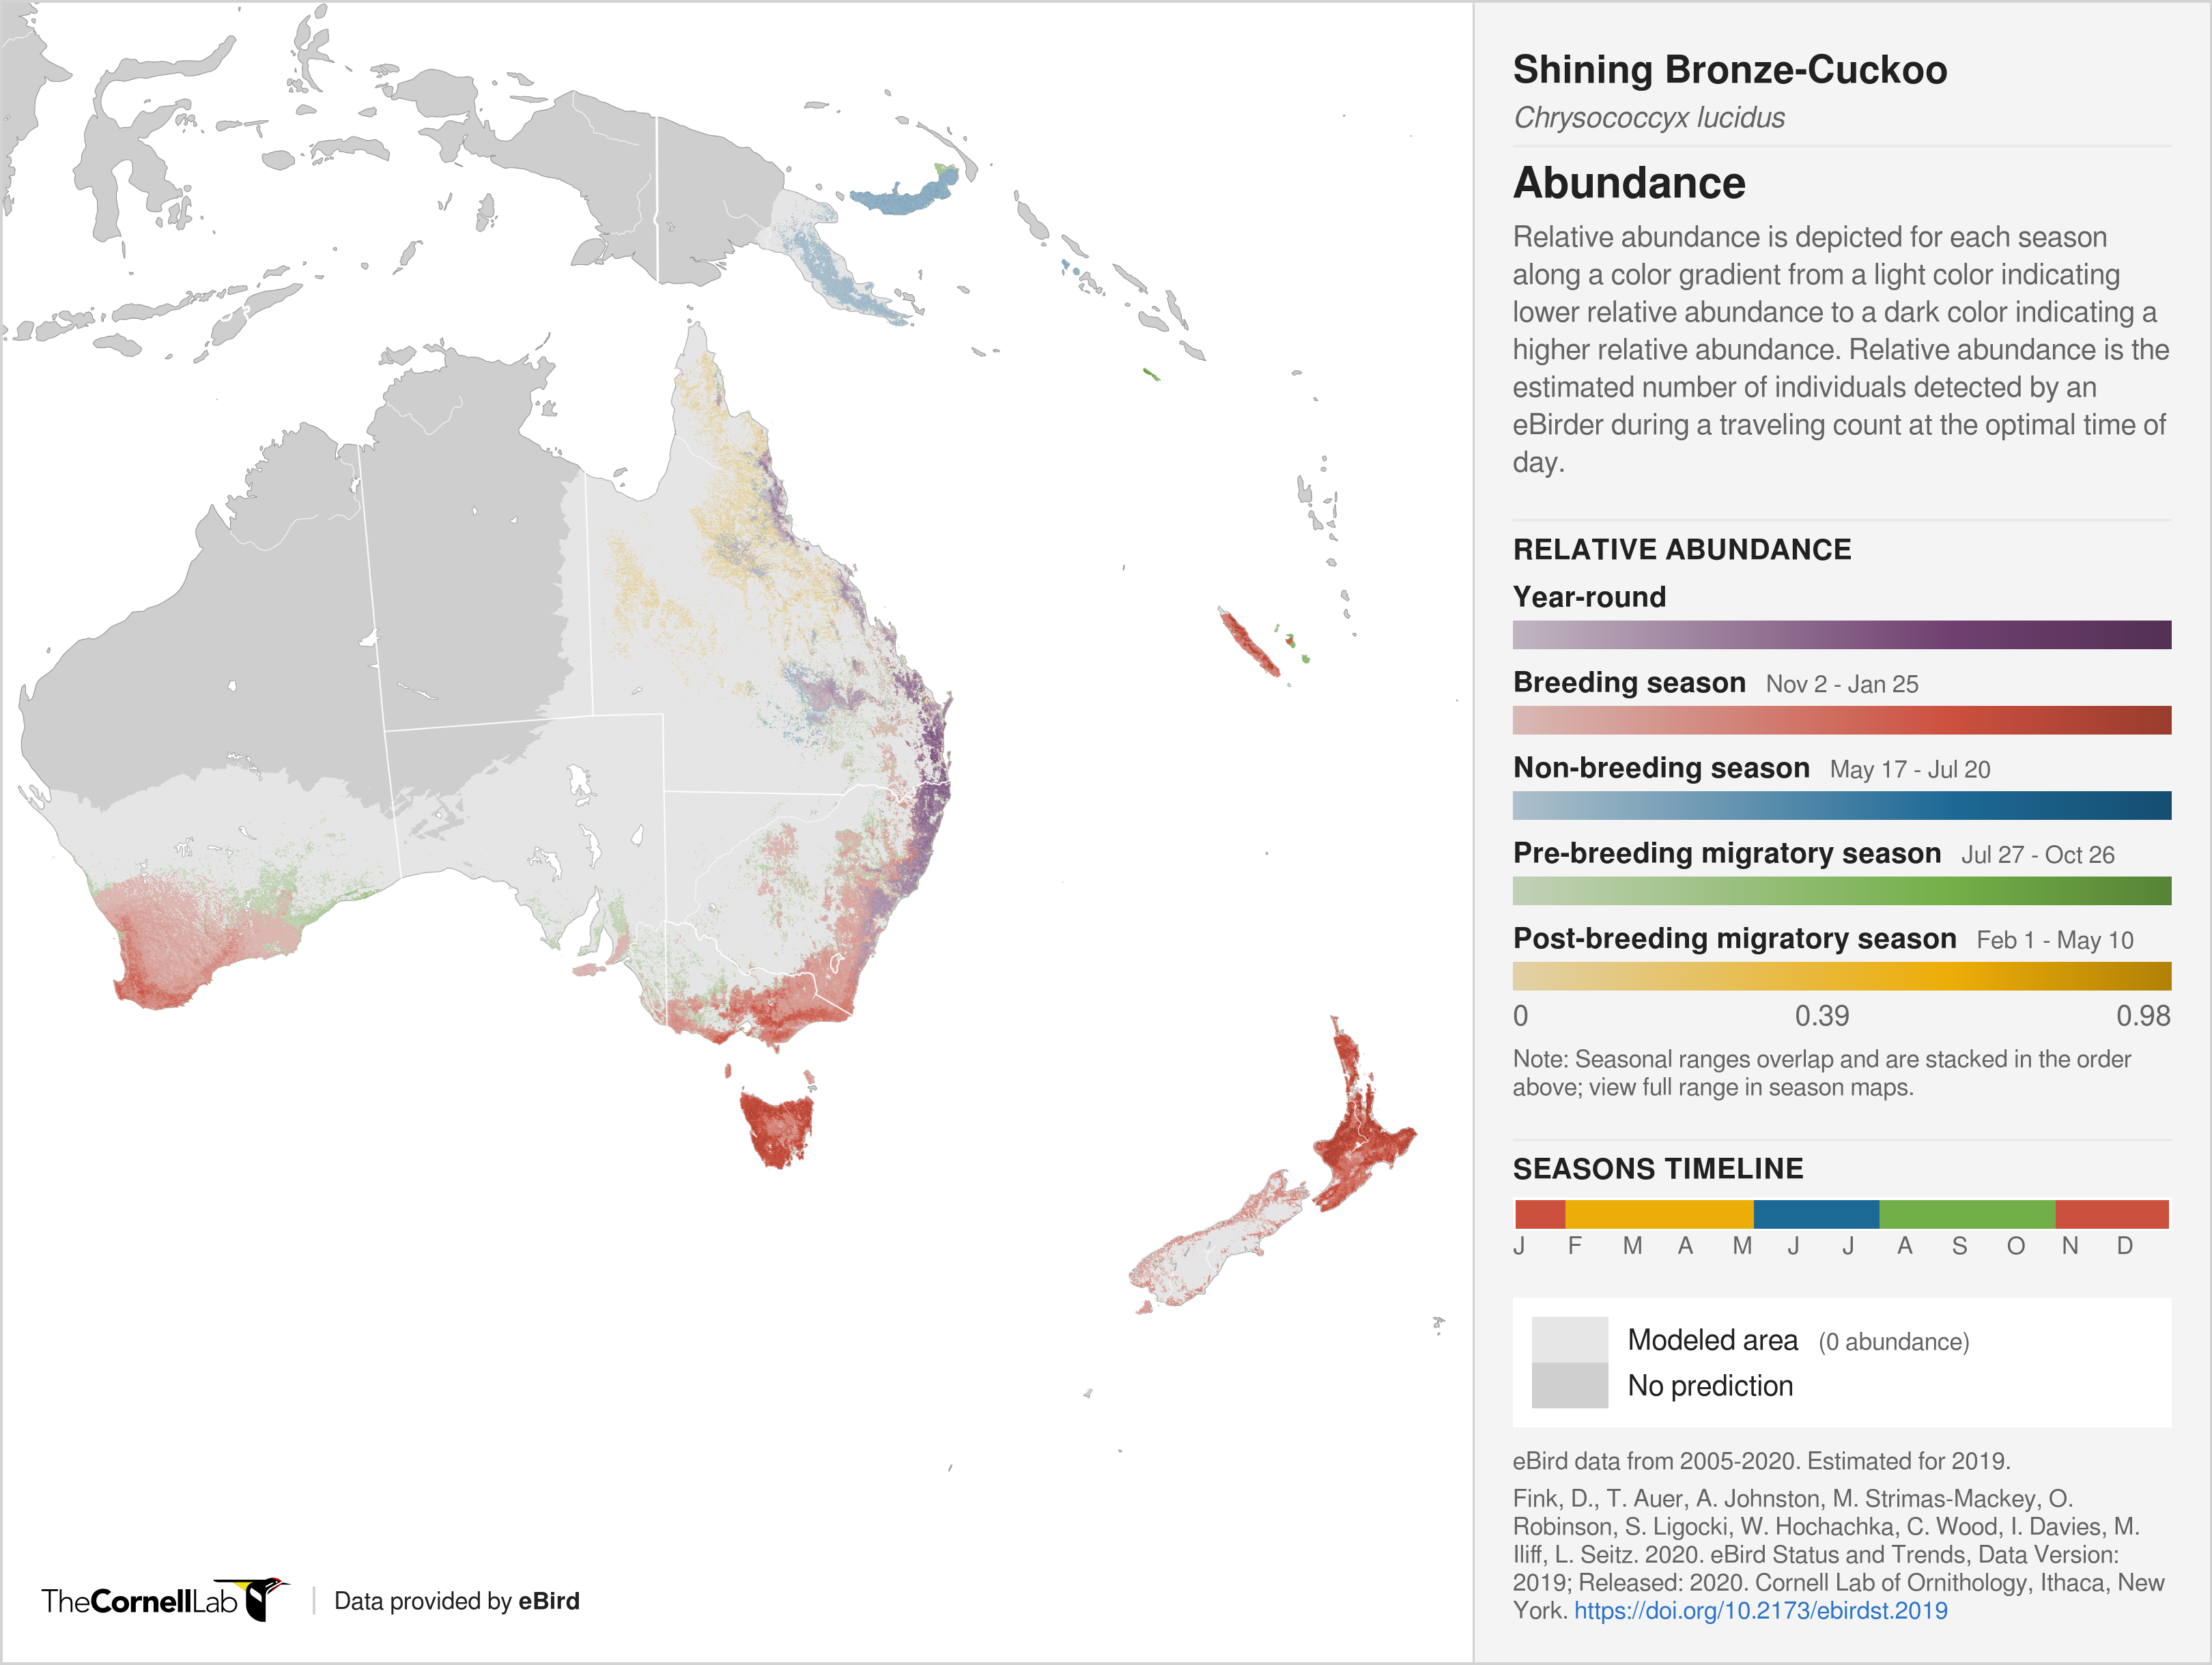
What is Relative Abundance?
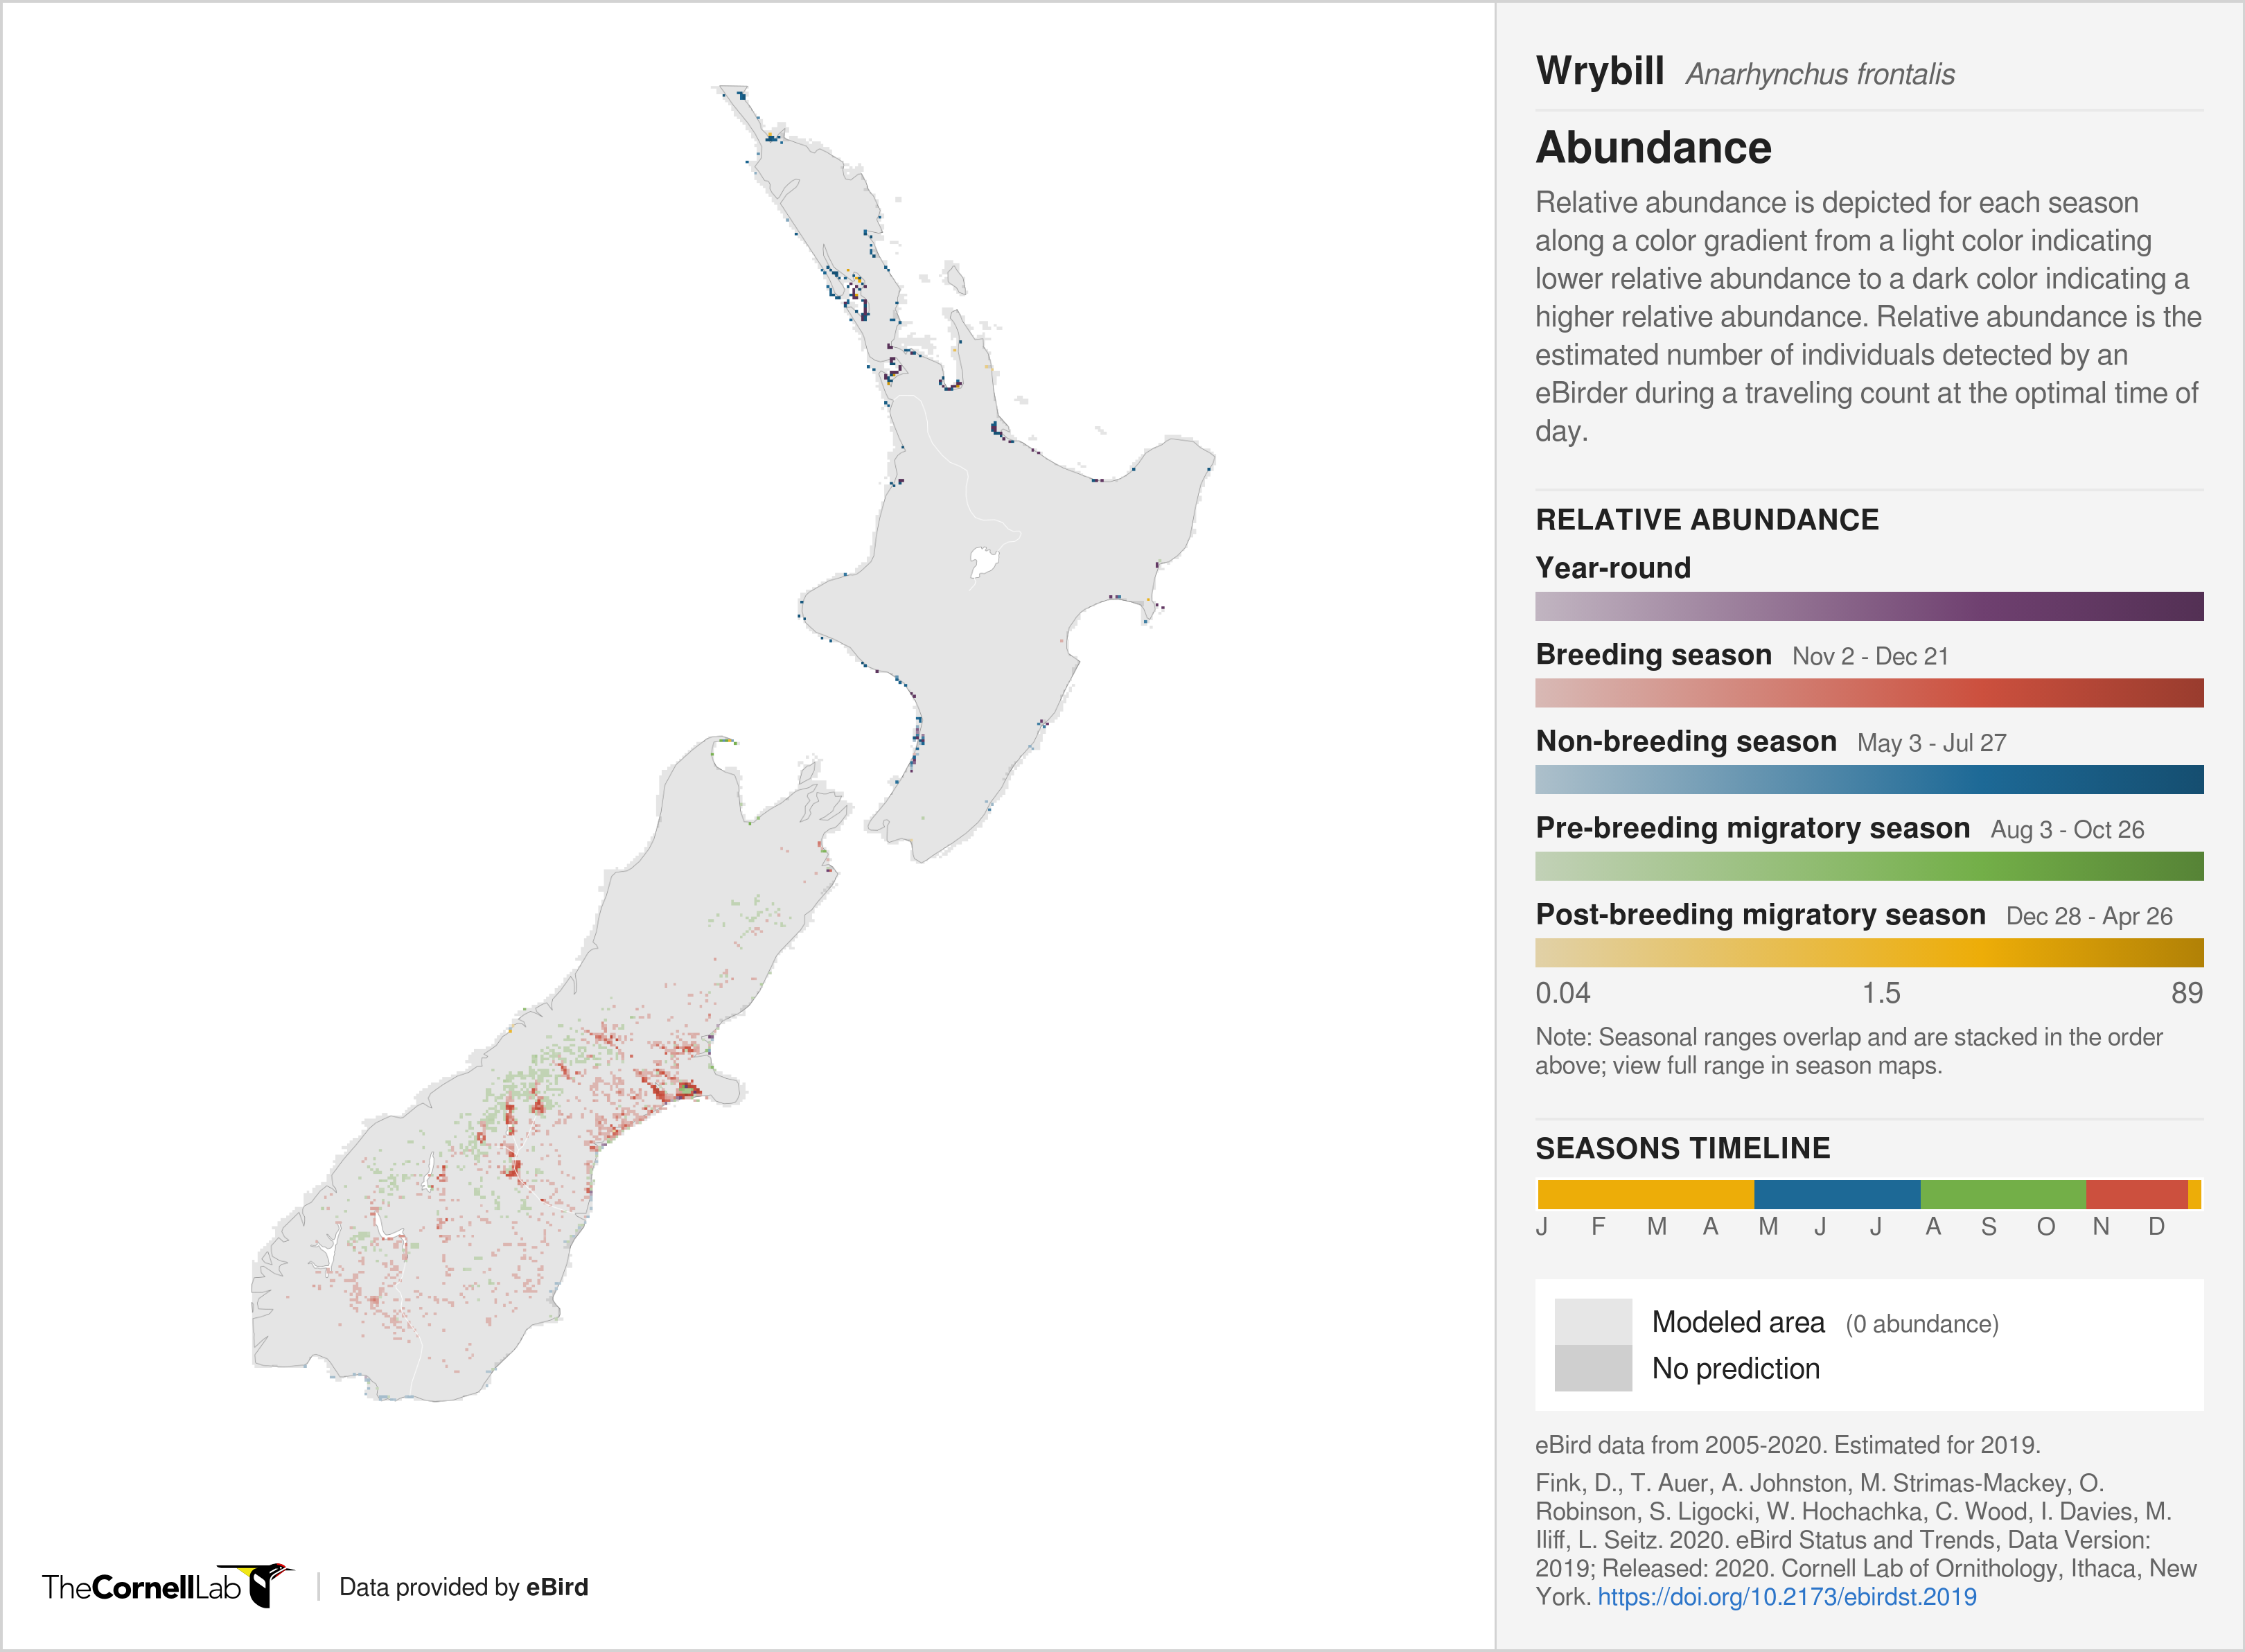
Relative abundance is the count of individuals of a given species detected by an expert eBirder at the optimal time of day, while expending the effort necessary to maximize detection of the species. For each species, relative abundance was estimated for all 52 weeks of the year across a regular spatial grid with a density of one location per 2.96 km × 2.96 km grid cell. Estimates at each location and date were made based on the local habitat, elevation, and topography at that location. Because detecting birds in the environment can be difficult, we know that there are always some individual birds that are missed by eBirders. For this reason, the eBird team refers to the quantity estimated as a relative measure of abundance. Although the relative abundance estimates will underestimate the true abundance, they do provide a standardized index that can be used to compare abundance in different regions. For example, if relative abundance is 10 in one area and 5 in another area, then we would estimate abundance is twice as high in the first area, even if we’re not sure of the actual number of individuals in the area.
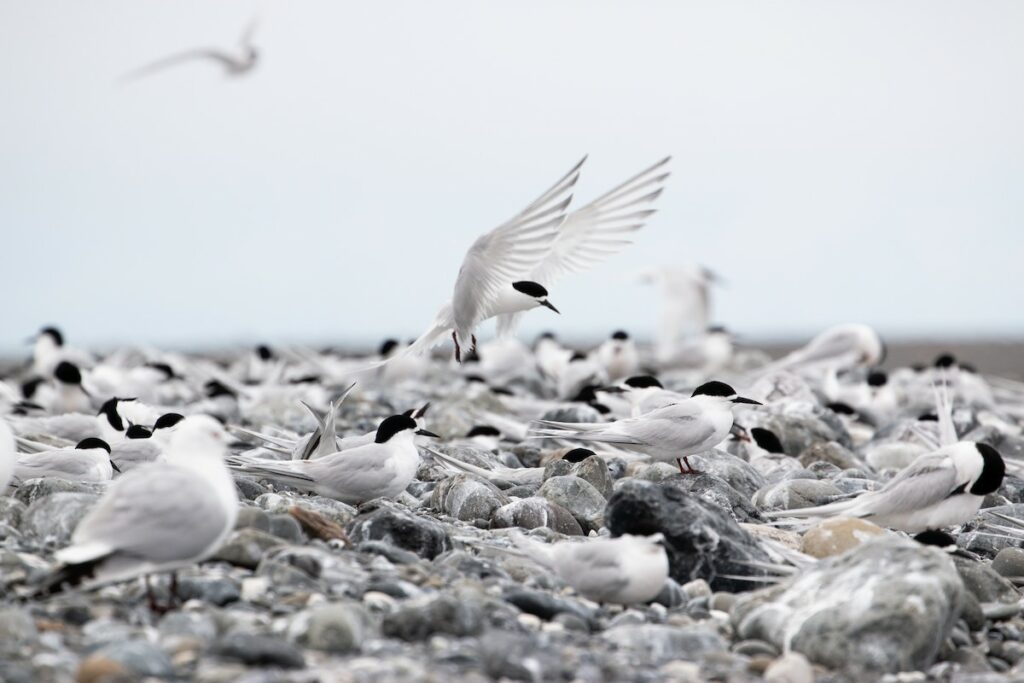
White-fronted Tern/Tara | Sterna striata © Dan Burgin / Macaulay Library
How do I contribute?
To ensure your Atlas eBird checklists are most useful to scientific efforts, you can easily make your checklists more scientifically valuable by ensuring you:
- Submit complete checklists (i.e., record all species you were able to identify by sight/sound without intentionally leaving anything off).
- Provide an accurate count or best estimate of the number of individuals for each species.
- Use one of these protocols: ‘Traveling’ or ‘Stationary’ count, and keep higher resolution checklists (no less than 5 minutes, and splitting travelling checklists into roughly 1km sections).
- Provide information on the start time, duration, number of observers, and distance traveled (The eBird mobile App now does many of these automatically for you with the new tracks).
- Provide documentation of unusual sightings with detailed descriptions or photos.
Checklists used in current Status and Trends products must have met the following conditions to be included in analyses.
- Submitted as of 10 April 2020.
- Observation dates from 1 January 2005 through 10 April 2020.
- Complete checklists (all bird species detected and identified were included).
- The primary checklist in a shared checklist.
- Checklists that used the generic traveling or stationary protocols (i.e., not incidental protocol).
- If traveling checklists, were not longer than 10 kilometers.
- Not longer in duration than 24 hours.
- Contained information on: start time, duration, protocol, number of observers, and distance traveled.
- Accurate counts of species were available (i.e., not just ‘present’ or an ‘X’)
NZ Species Map Data
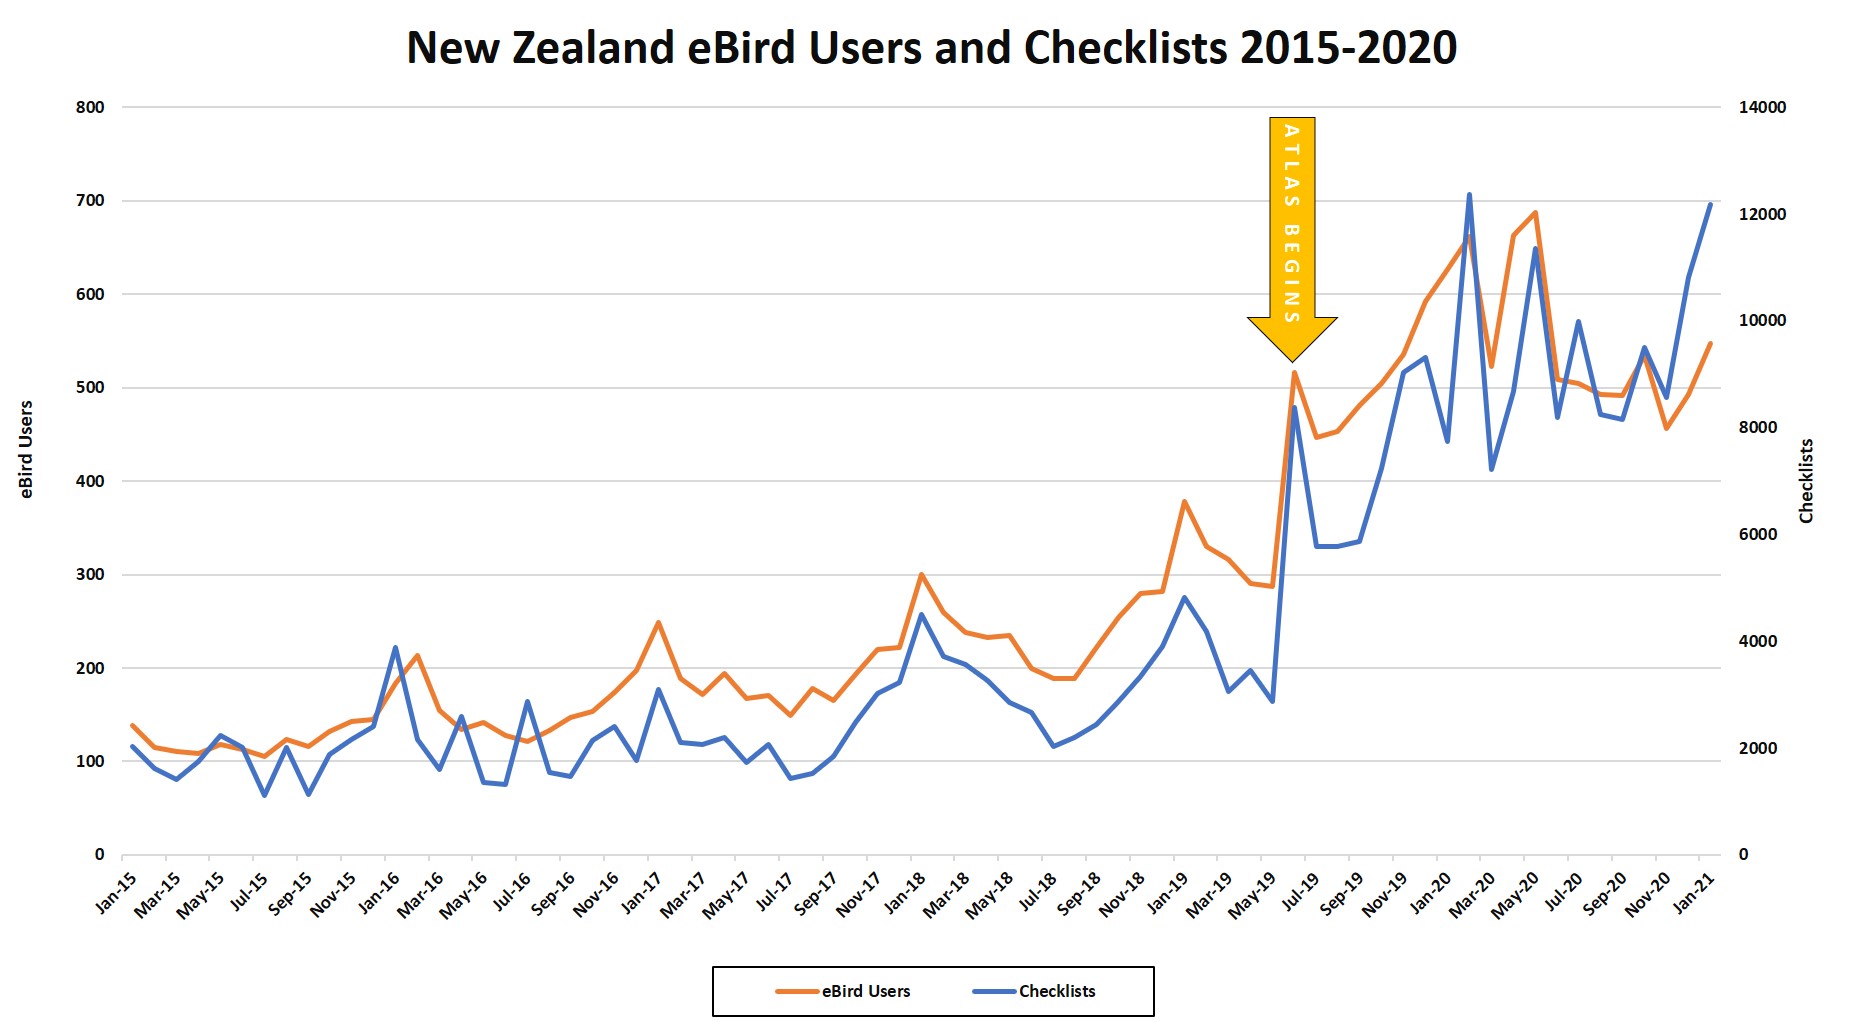
It is important to note that these maps are the first produced for these NZ species, and are solely from eBird data. Different products require different volumes of data and the most data-intensive products such as trend maps are only available for some of the species and seasons. The data used in these current NZ maps ranges from 2005-2019 and the models often worked on a very fragmented or limited dataset across the country due to a historical paucity of data. Yet they provide the first steps towards dynamic models of species distributions. Some areas within a species’ range unfortunately did not have enough data to be modeled with confidence. This was true for one of the species we asked the eBird team to model; Whio/Blue Duck (Hymenolaimus malacorhynchos). The results were over extrapolating due to a lack of solid observations across their range and we were unable to get a modelled map produced. Our hope is that next year the additional data through the Atlas project will allow the eBird team to produce an abundance map for this species. This will likely be true for many other species in Aotearoa, particularly those rarer species with very contracted ranges. We feel this provides a great incentive to all further our efforts to try and capture more data across the country for a variety of species. Looking at the graph below we can see how since the Atlas began there has been a rapid increase in the volume of data going into eBird in Aotearoa. For example, in January 2015 there were a total of 2,073 checklists submitted, and in February 2020 NZ birders submitted a total of 12,374 checklists, the highest monthly total so far (Jan 2021 was nearly as high!). This represents a 497% increase in data being submitted in a month!
We know these models will constantly be improved upon as more and more higher quality data goes into eBird in New Zealand. The NZ Bird Atlas is going to provide a wealth of incredible data to help refine these models even further, and hint at what is possible to produce at the end of the 5 year data collection period in June 2024. You may look at these maps and see area predictions for species that you don’t think are correct. If that is the case we strongly encourage you to try go to those areas and submit more data to increase the data showing their presence or absence. The only way we are going to better these modelled predictions is through Atlas participants scouring the country and submitting complete checklists with accurate abundances for all species. Our drive is to ensure the quality of data going into the Atlas is robust enough to generate high quality results that are even better than these models. After all they will only get more accurate and more powerful the more data we submit.
The Atlas team is continually driven to continue advocating for more people to get involved with the Atlas project, and for those participating to continue to contribute their sightings. Whatsmore is we have challenged the Atlas community to submit a daily checklist in 2021, as well as look at other areas to make personal challenges using eBird. We’ve also got regular challenges, the February Atlas challenge having finished now, the winner getting a signed copy of Oscar Thomas’s new book “A Naturalist’s Guide to New Zealand Birds“. We’ll be announcing the winner later this month! Keep your eyes peeled for April’s challenge.
More data will likely be coming from other sources too. We are in contact with DOC to incorporate their Tier 1 count data and are hoping to advocate more regional councils to enter their bird count data into eBird too. Several councils are already submitting data, such as Wellington and Hawkes Bay. If you know of other councils or organisations that may have a wealth of valuable data please let us know!
NZ Species Maps
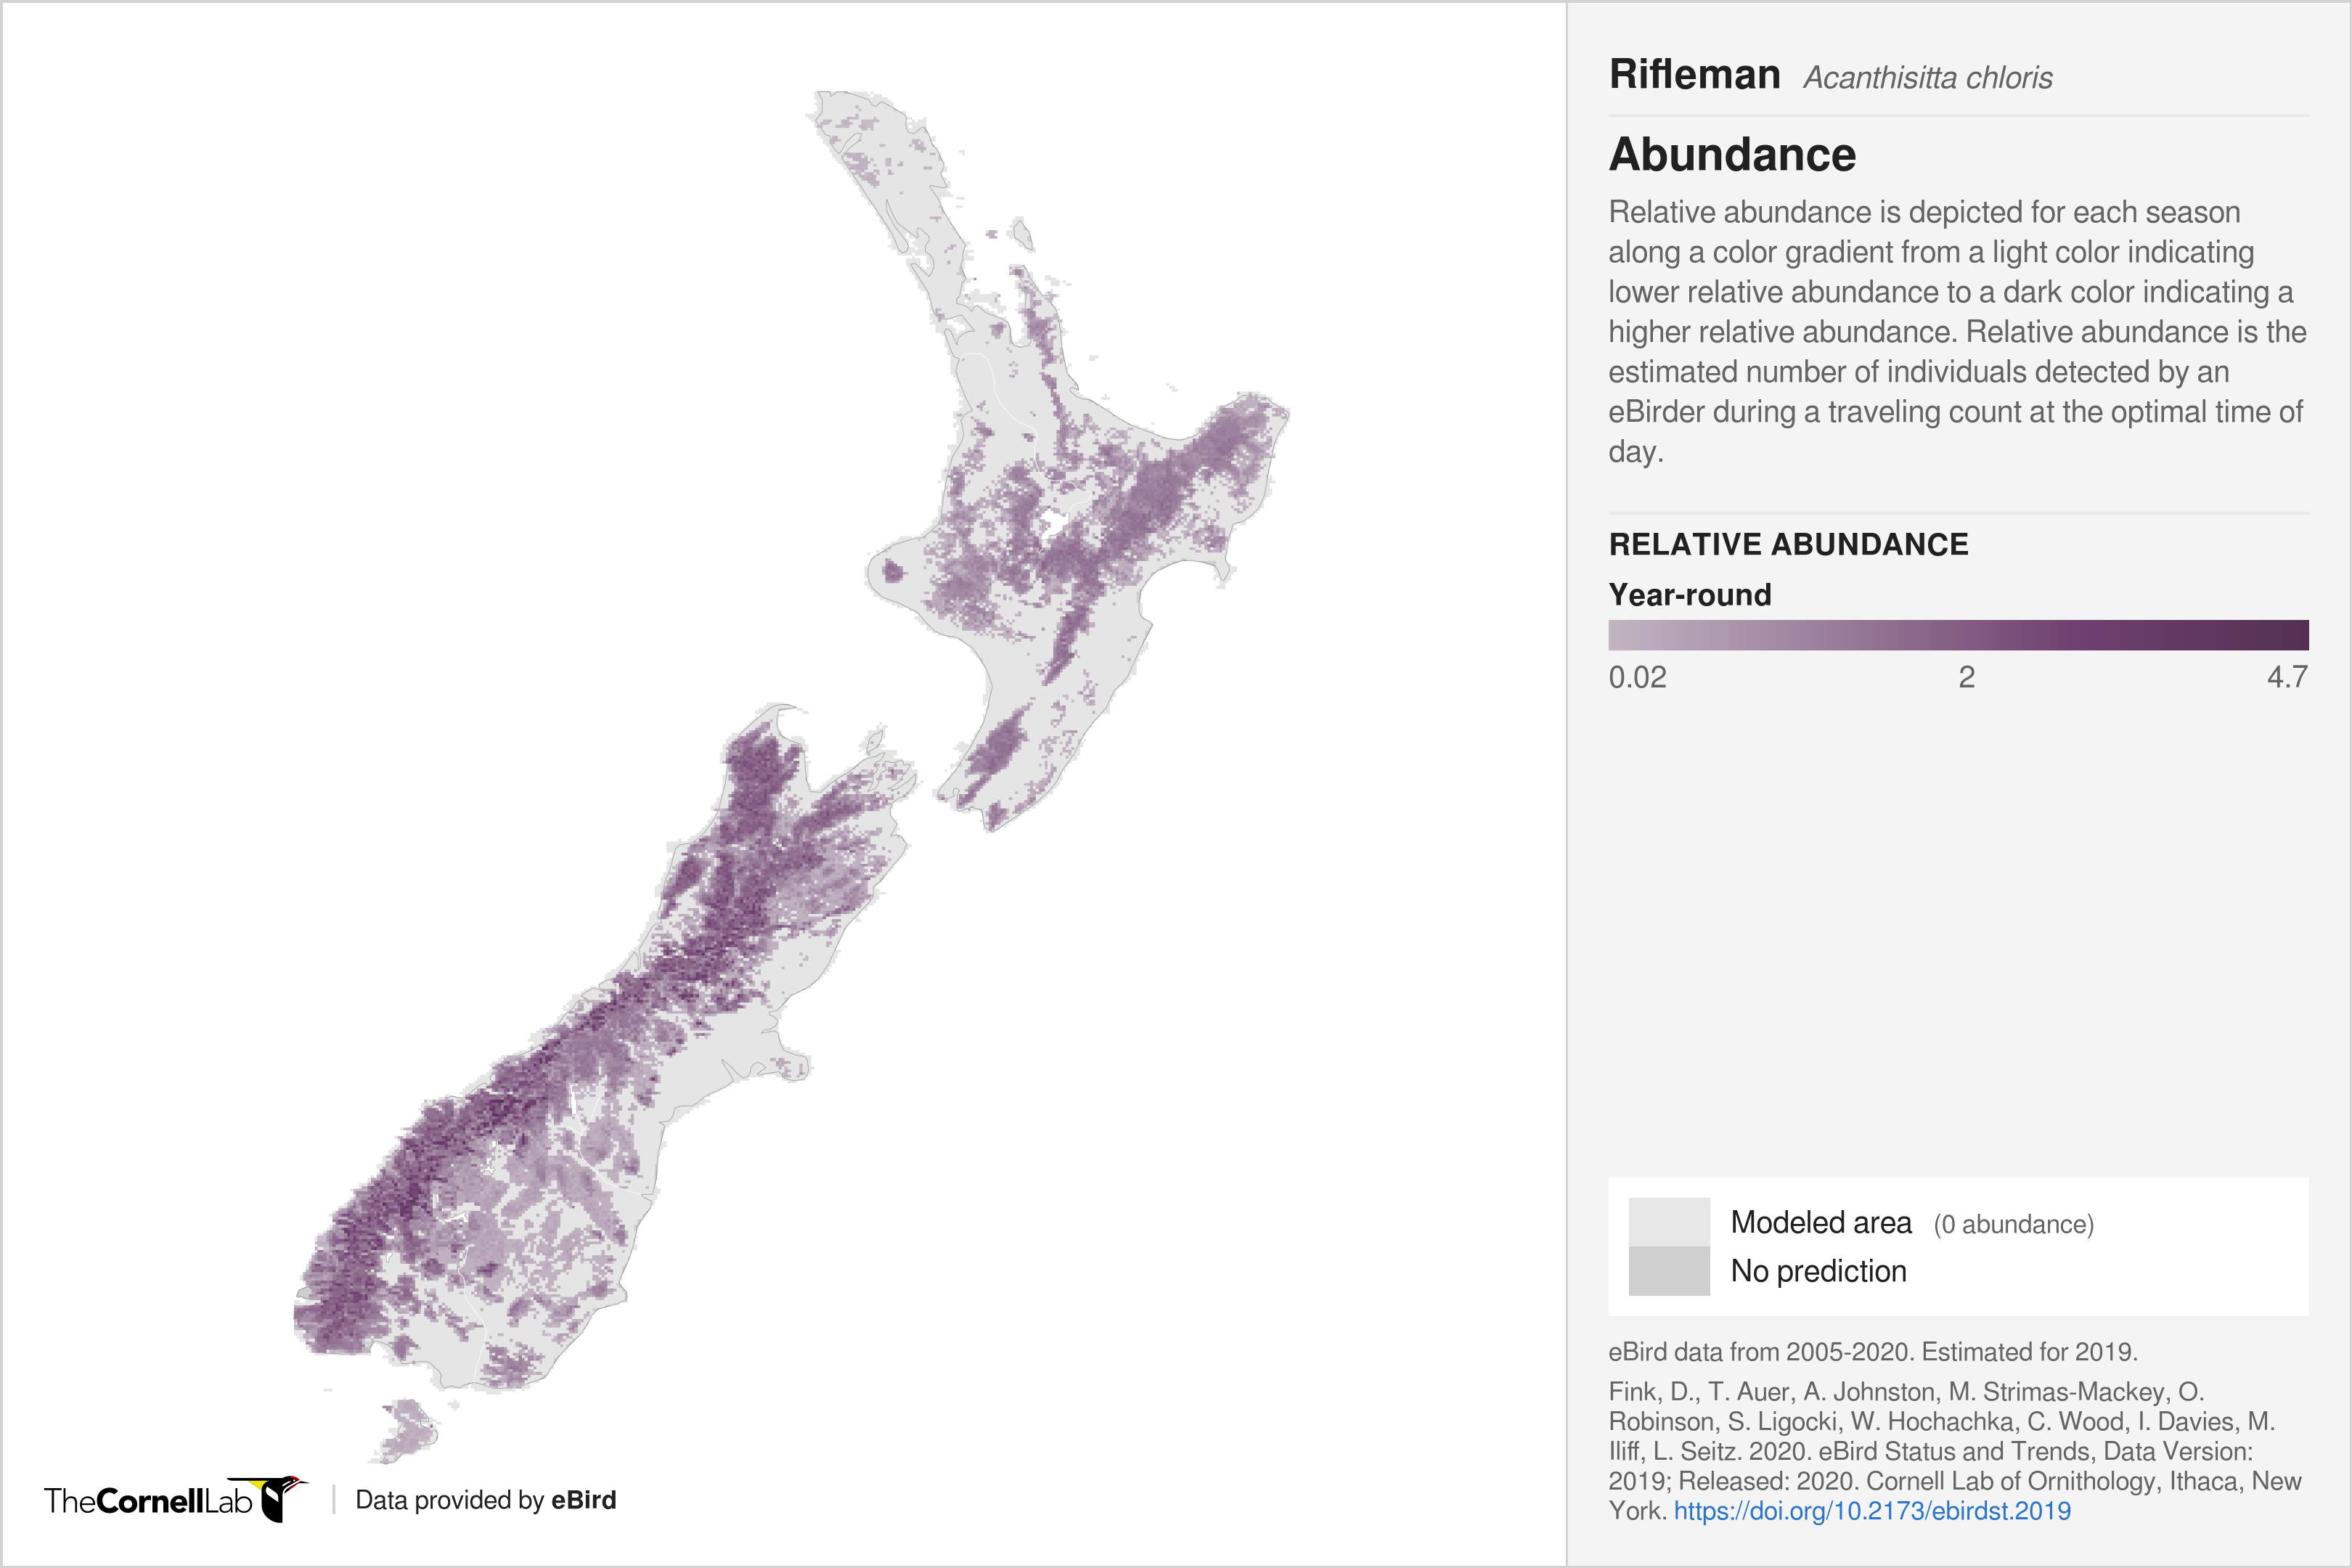
Maps are given below for all of the NZ species that were modelled. Relative abundance is depicted as a color gradient from yellow (low abundance) to dark purple (high abundance) for every week of the year. Areas of light gray indicate species absence (or very rare occurrence). Areas of dark gray indicate areas in which predictions could not be made due to lack of data.
Rifleman/tītitipounamu (Acanthisitta chloris)
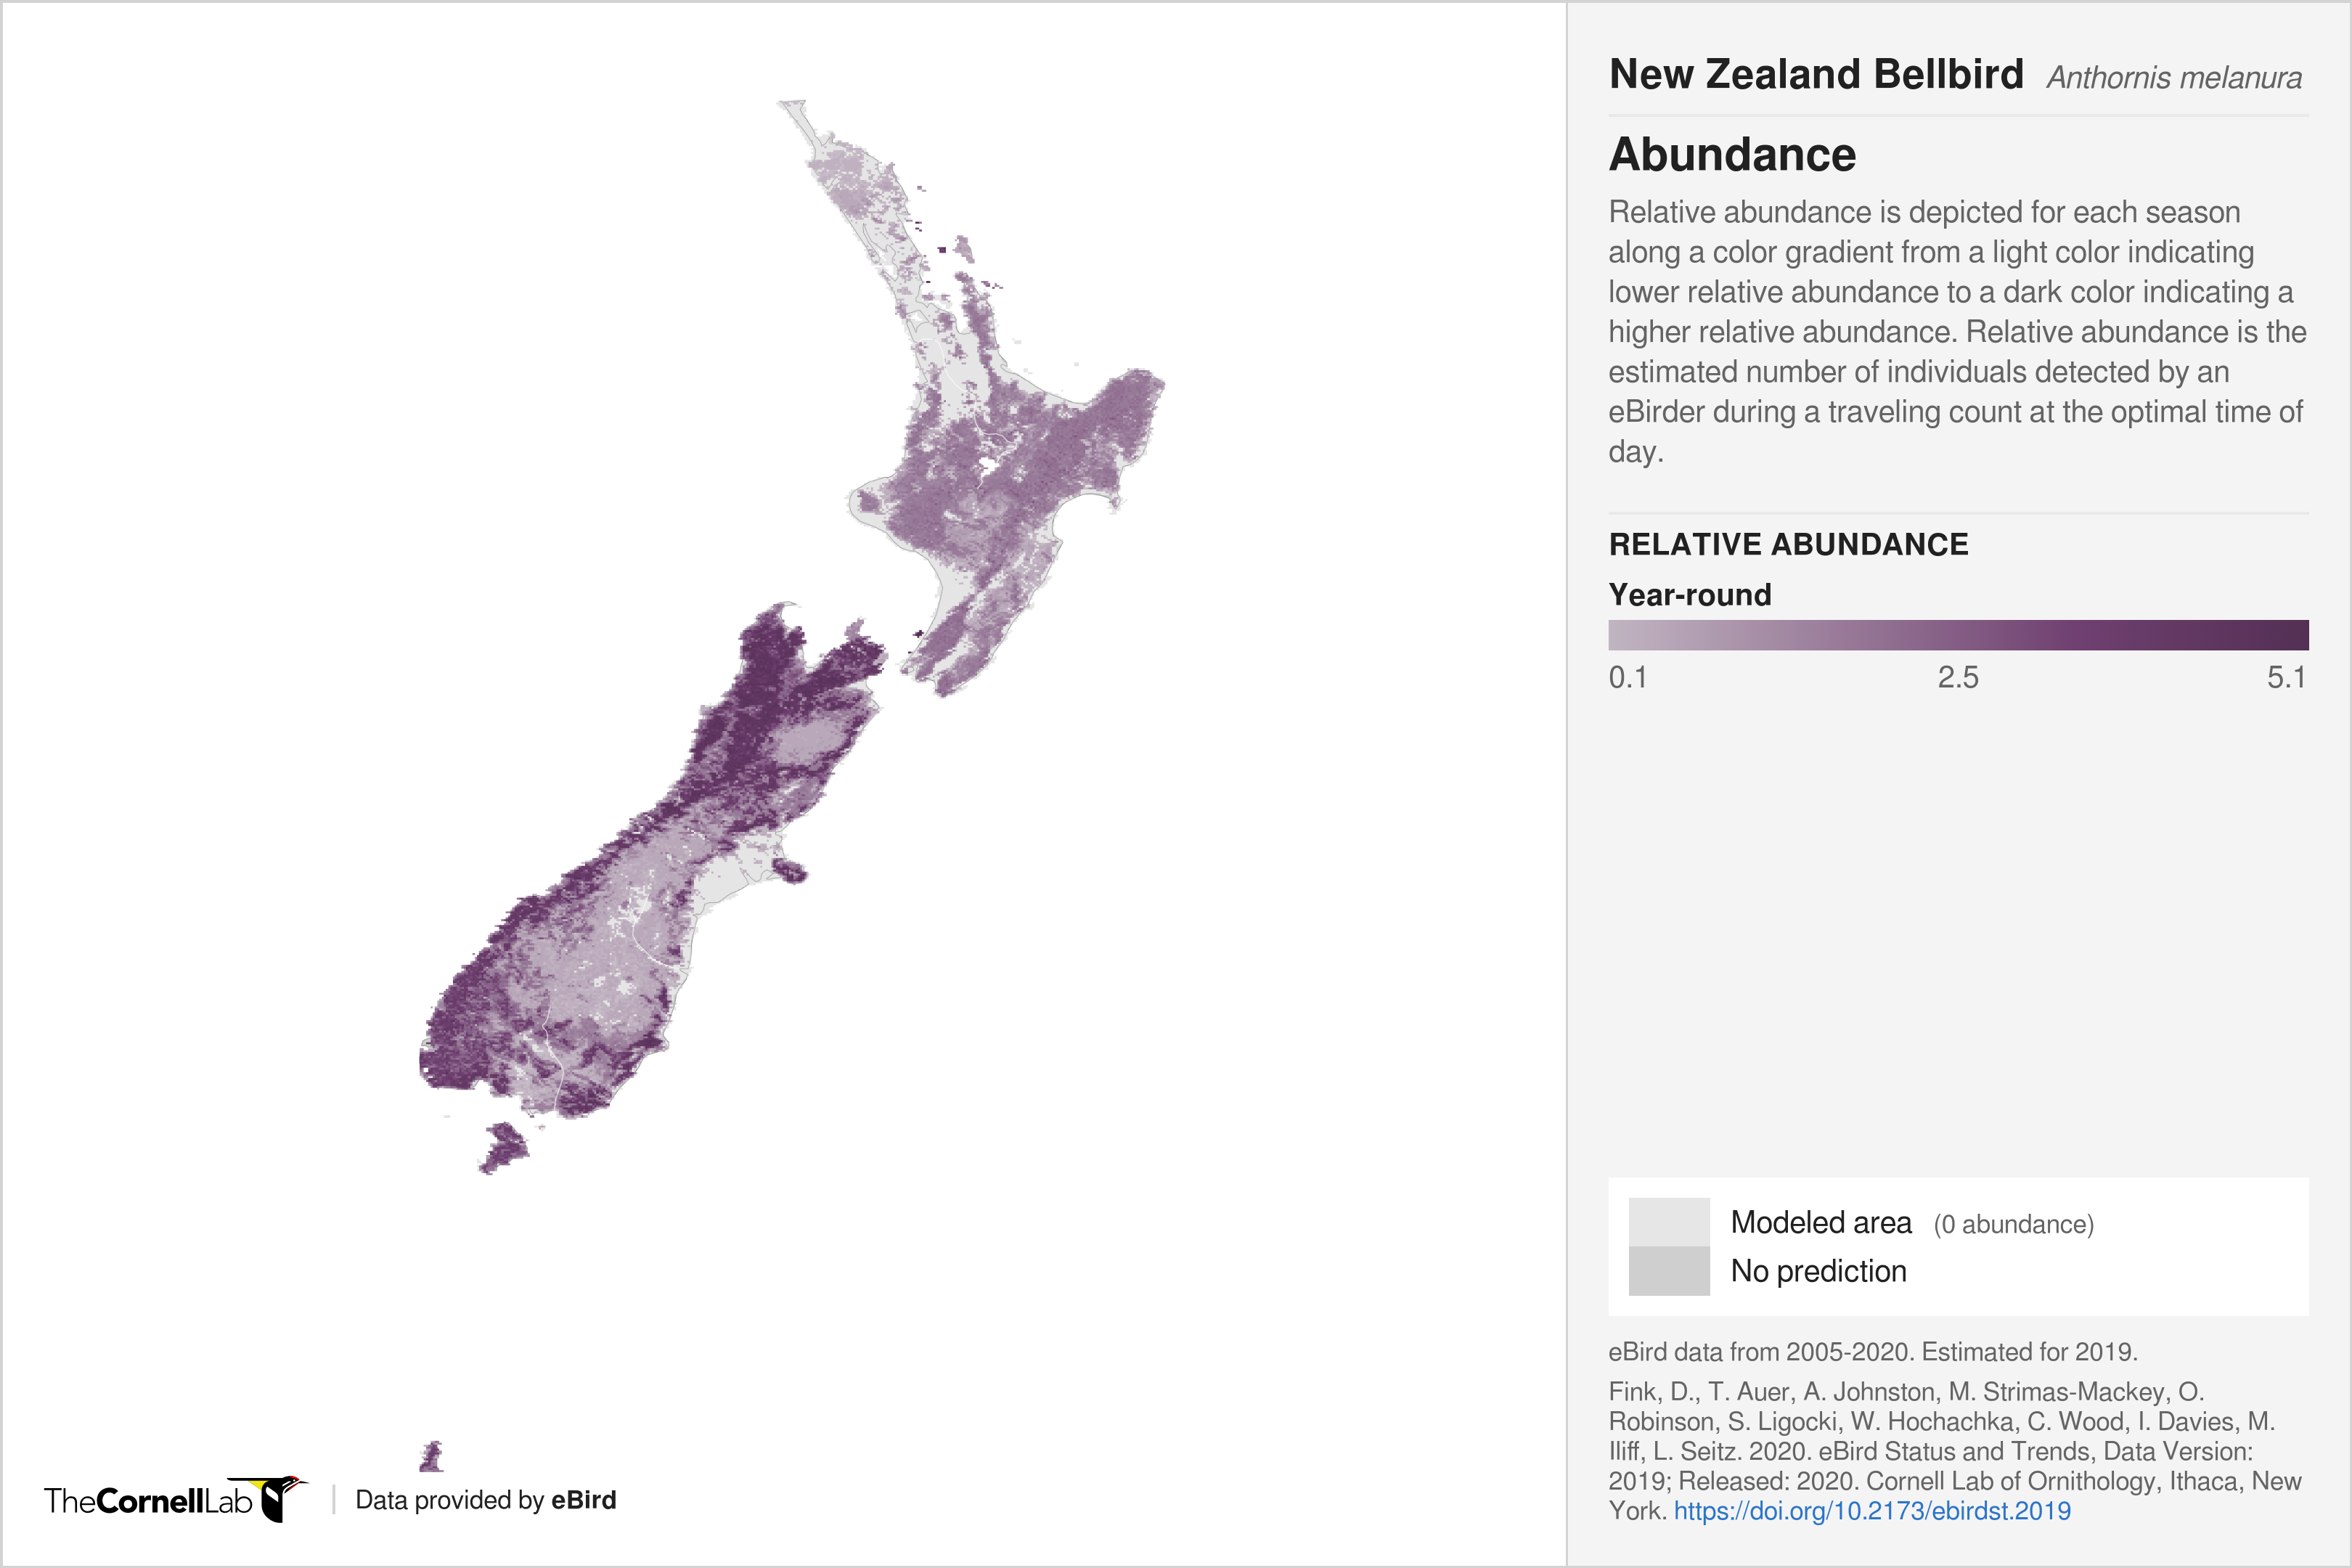
Bellbird/korimako (Anthornis melanura)
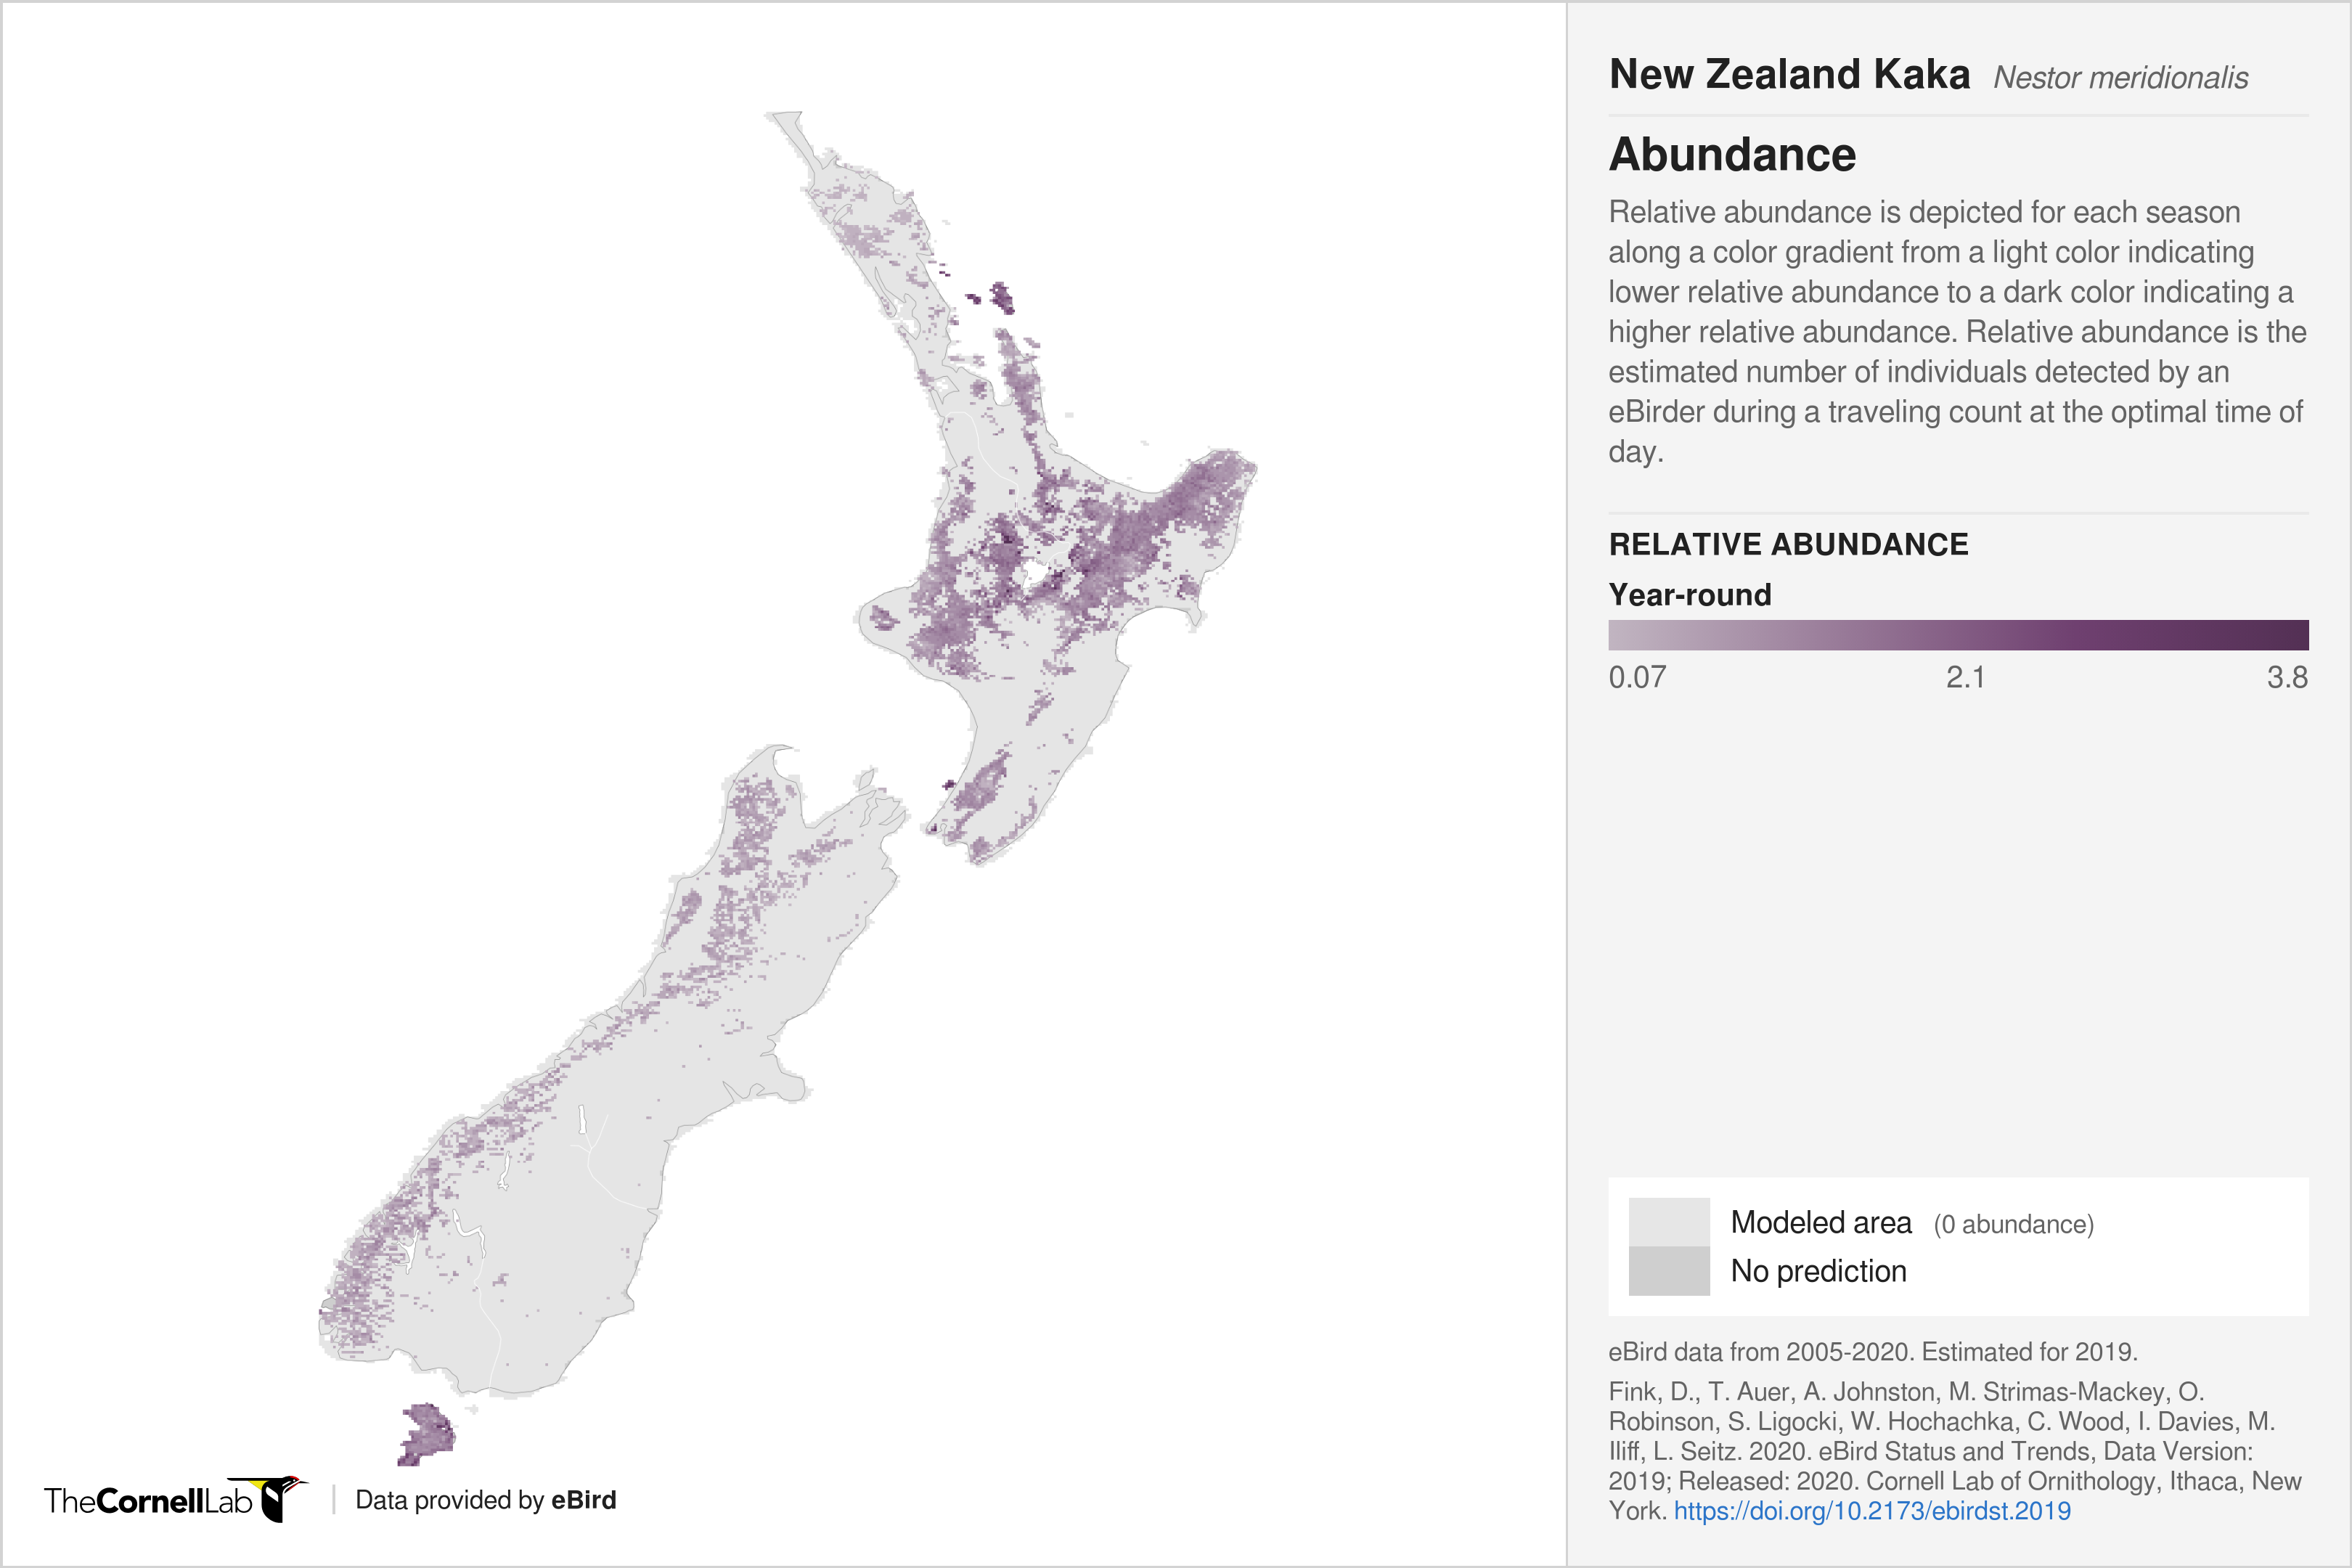
Kaka (Nestor meridionalis)
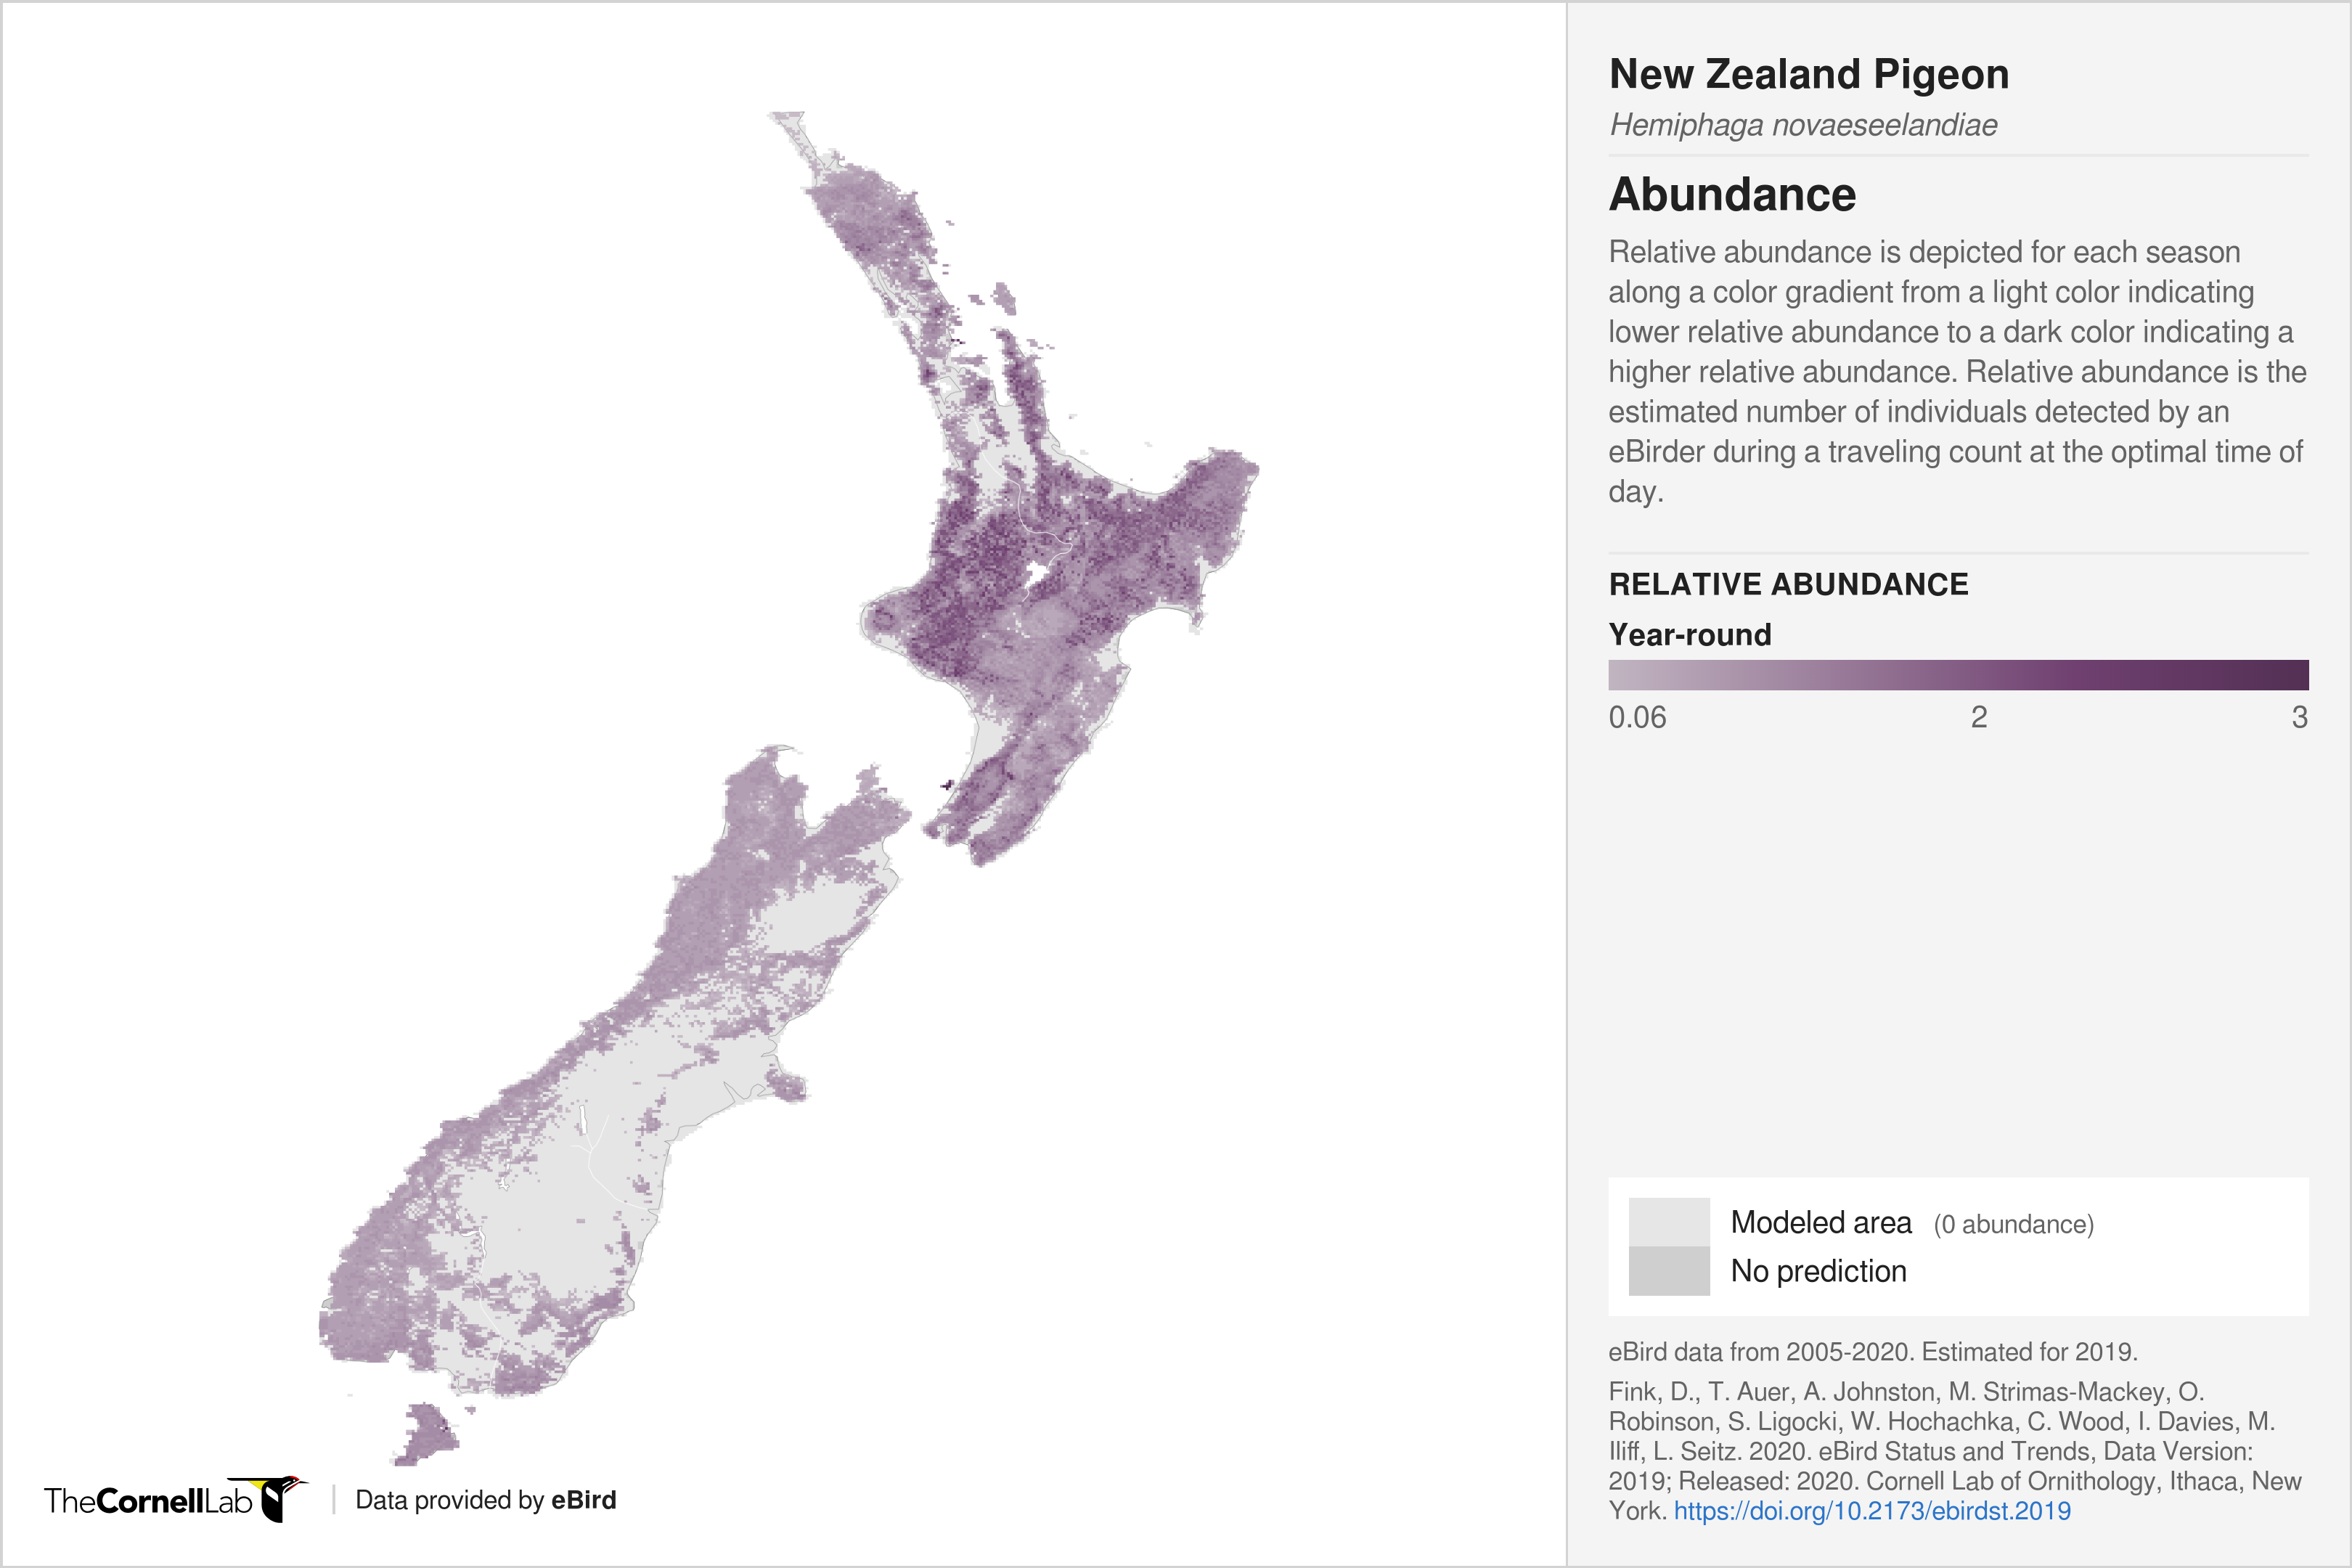
NZ Pigeon/Kereru (Hemiphaga novaeseelandiae)
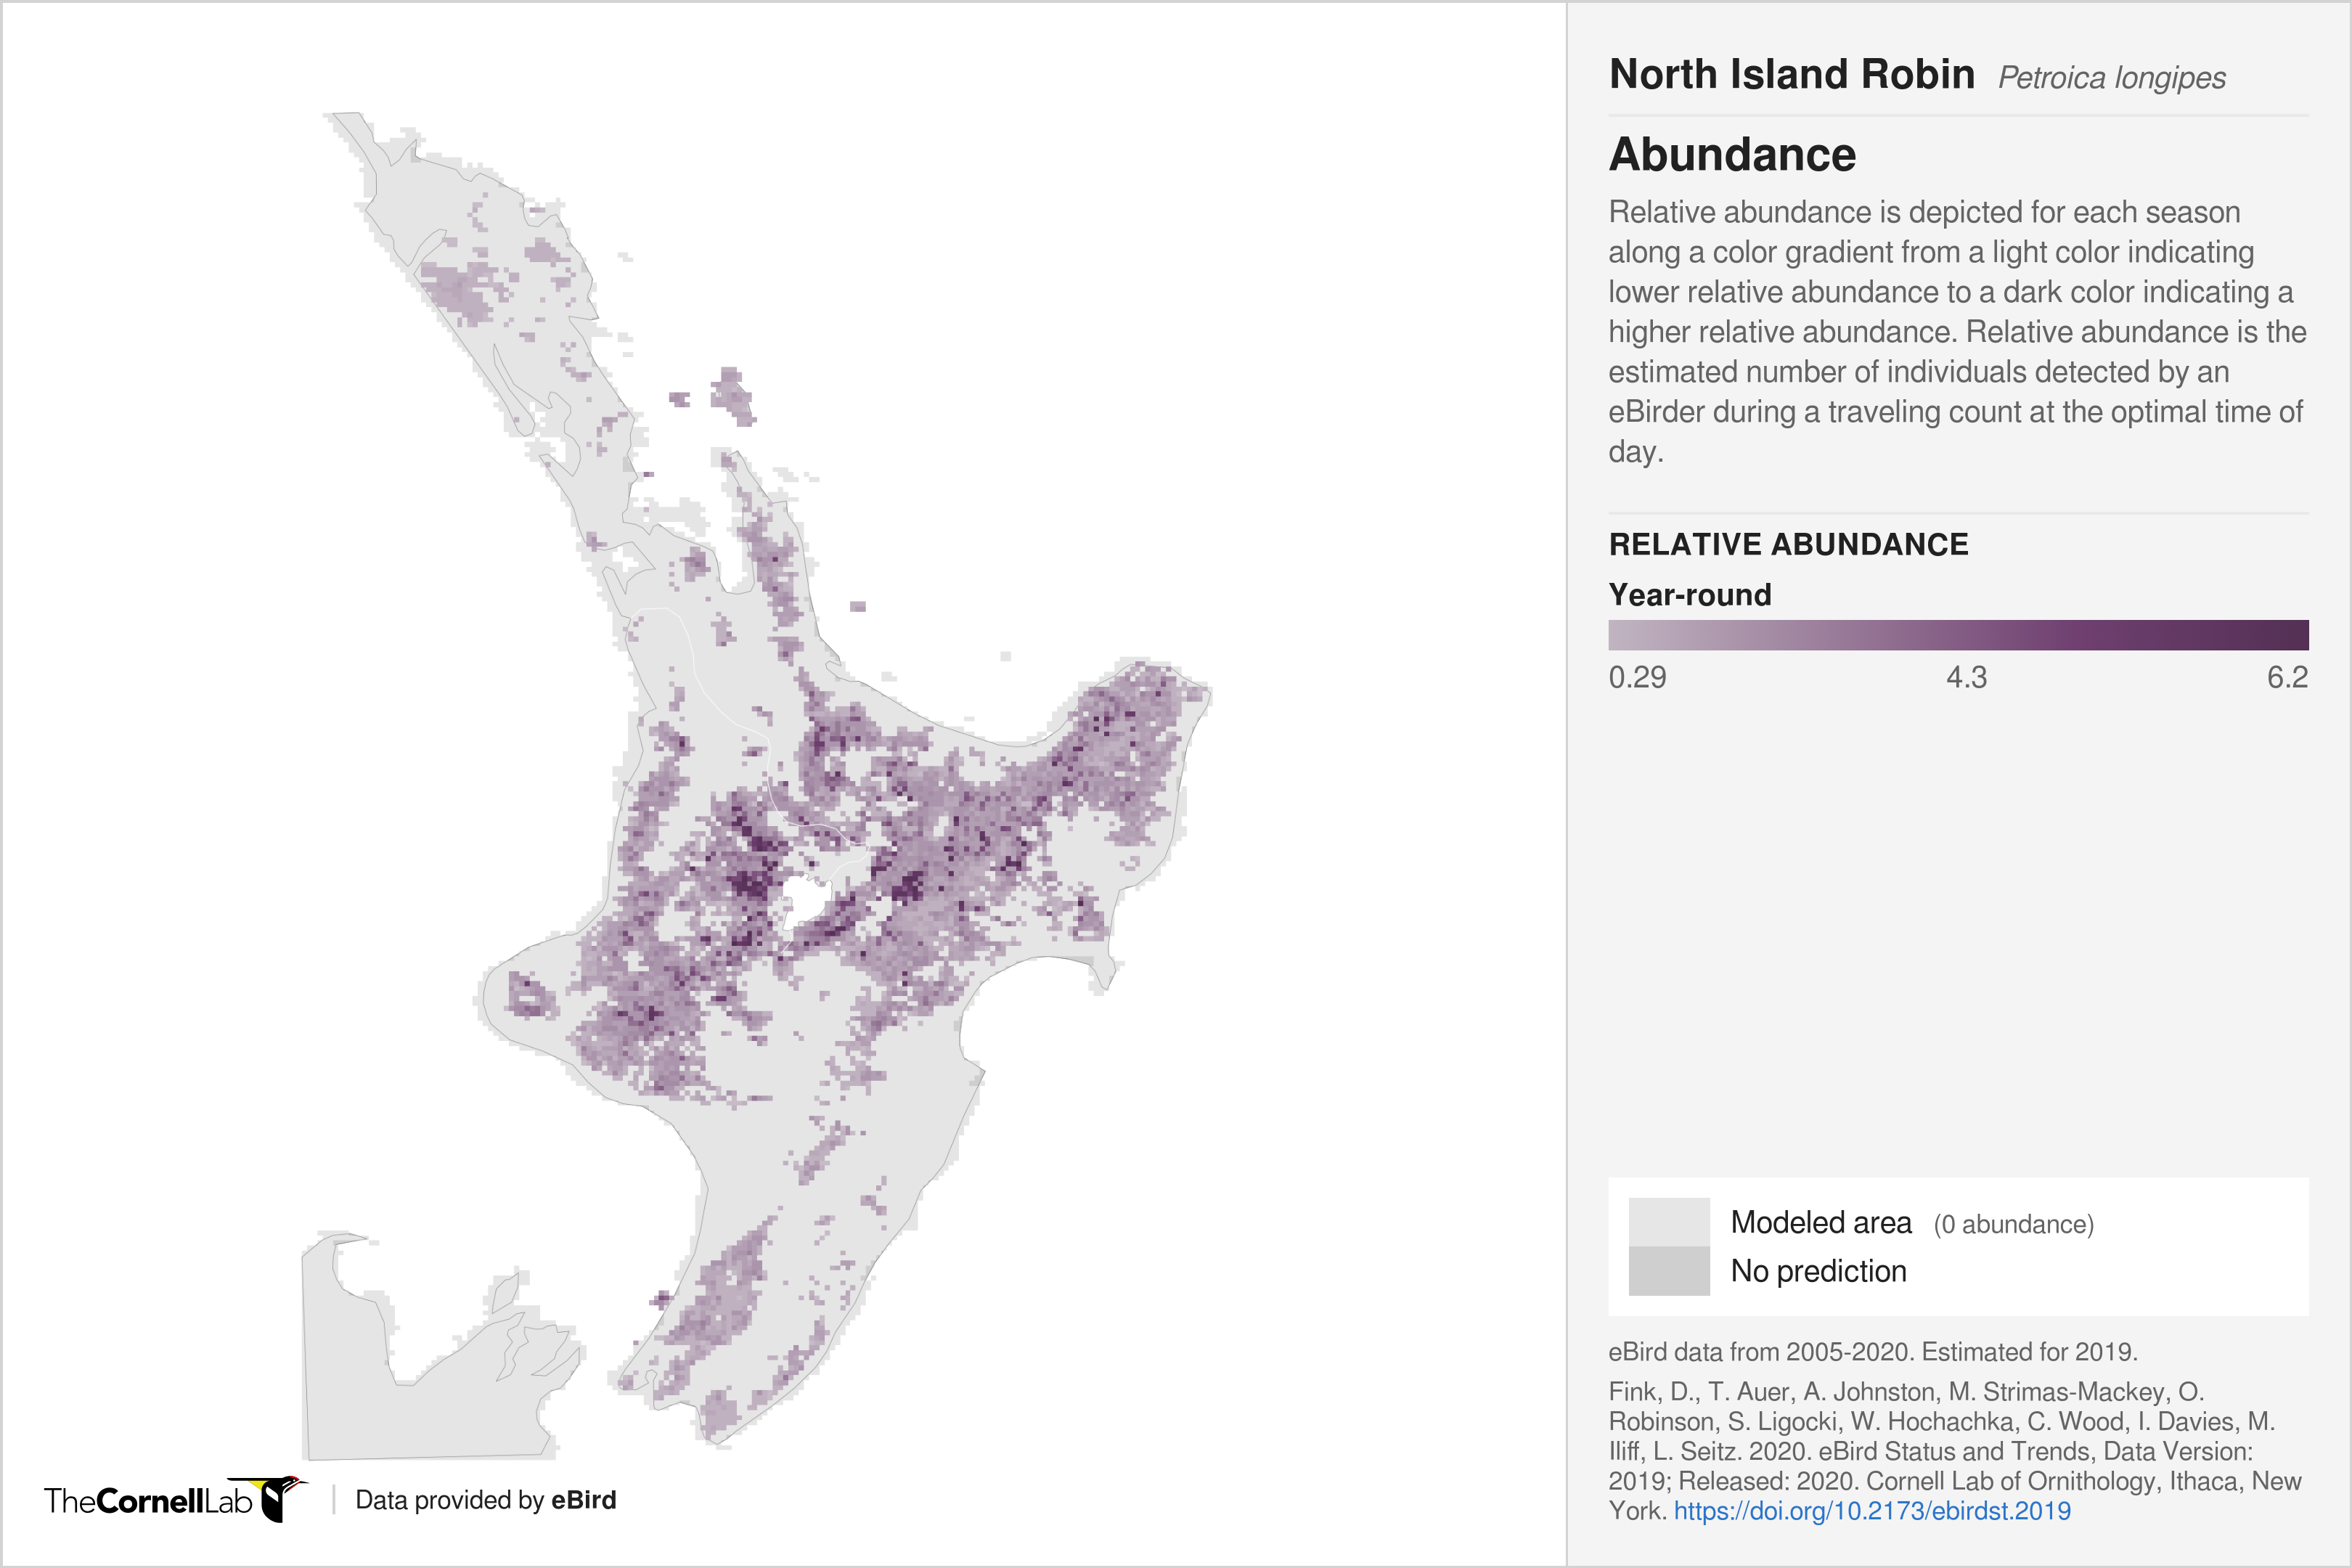
North Island Robin/toutouwai (Petroica longipes)
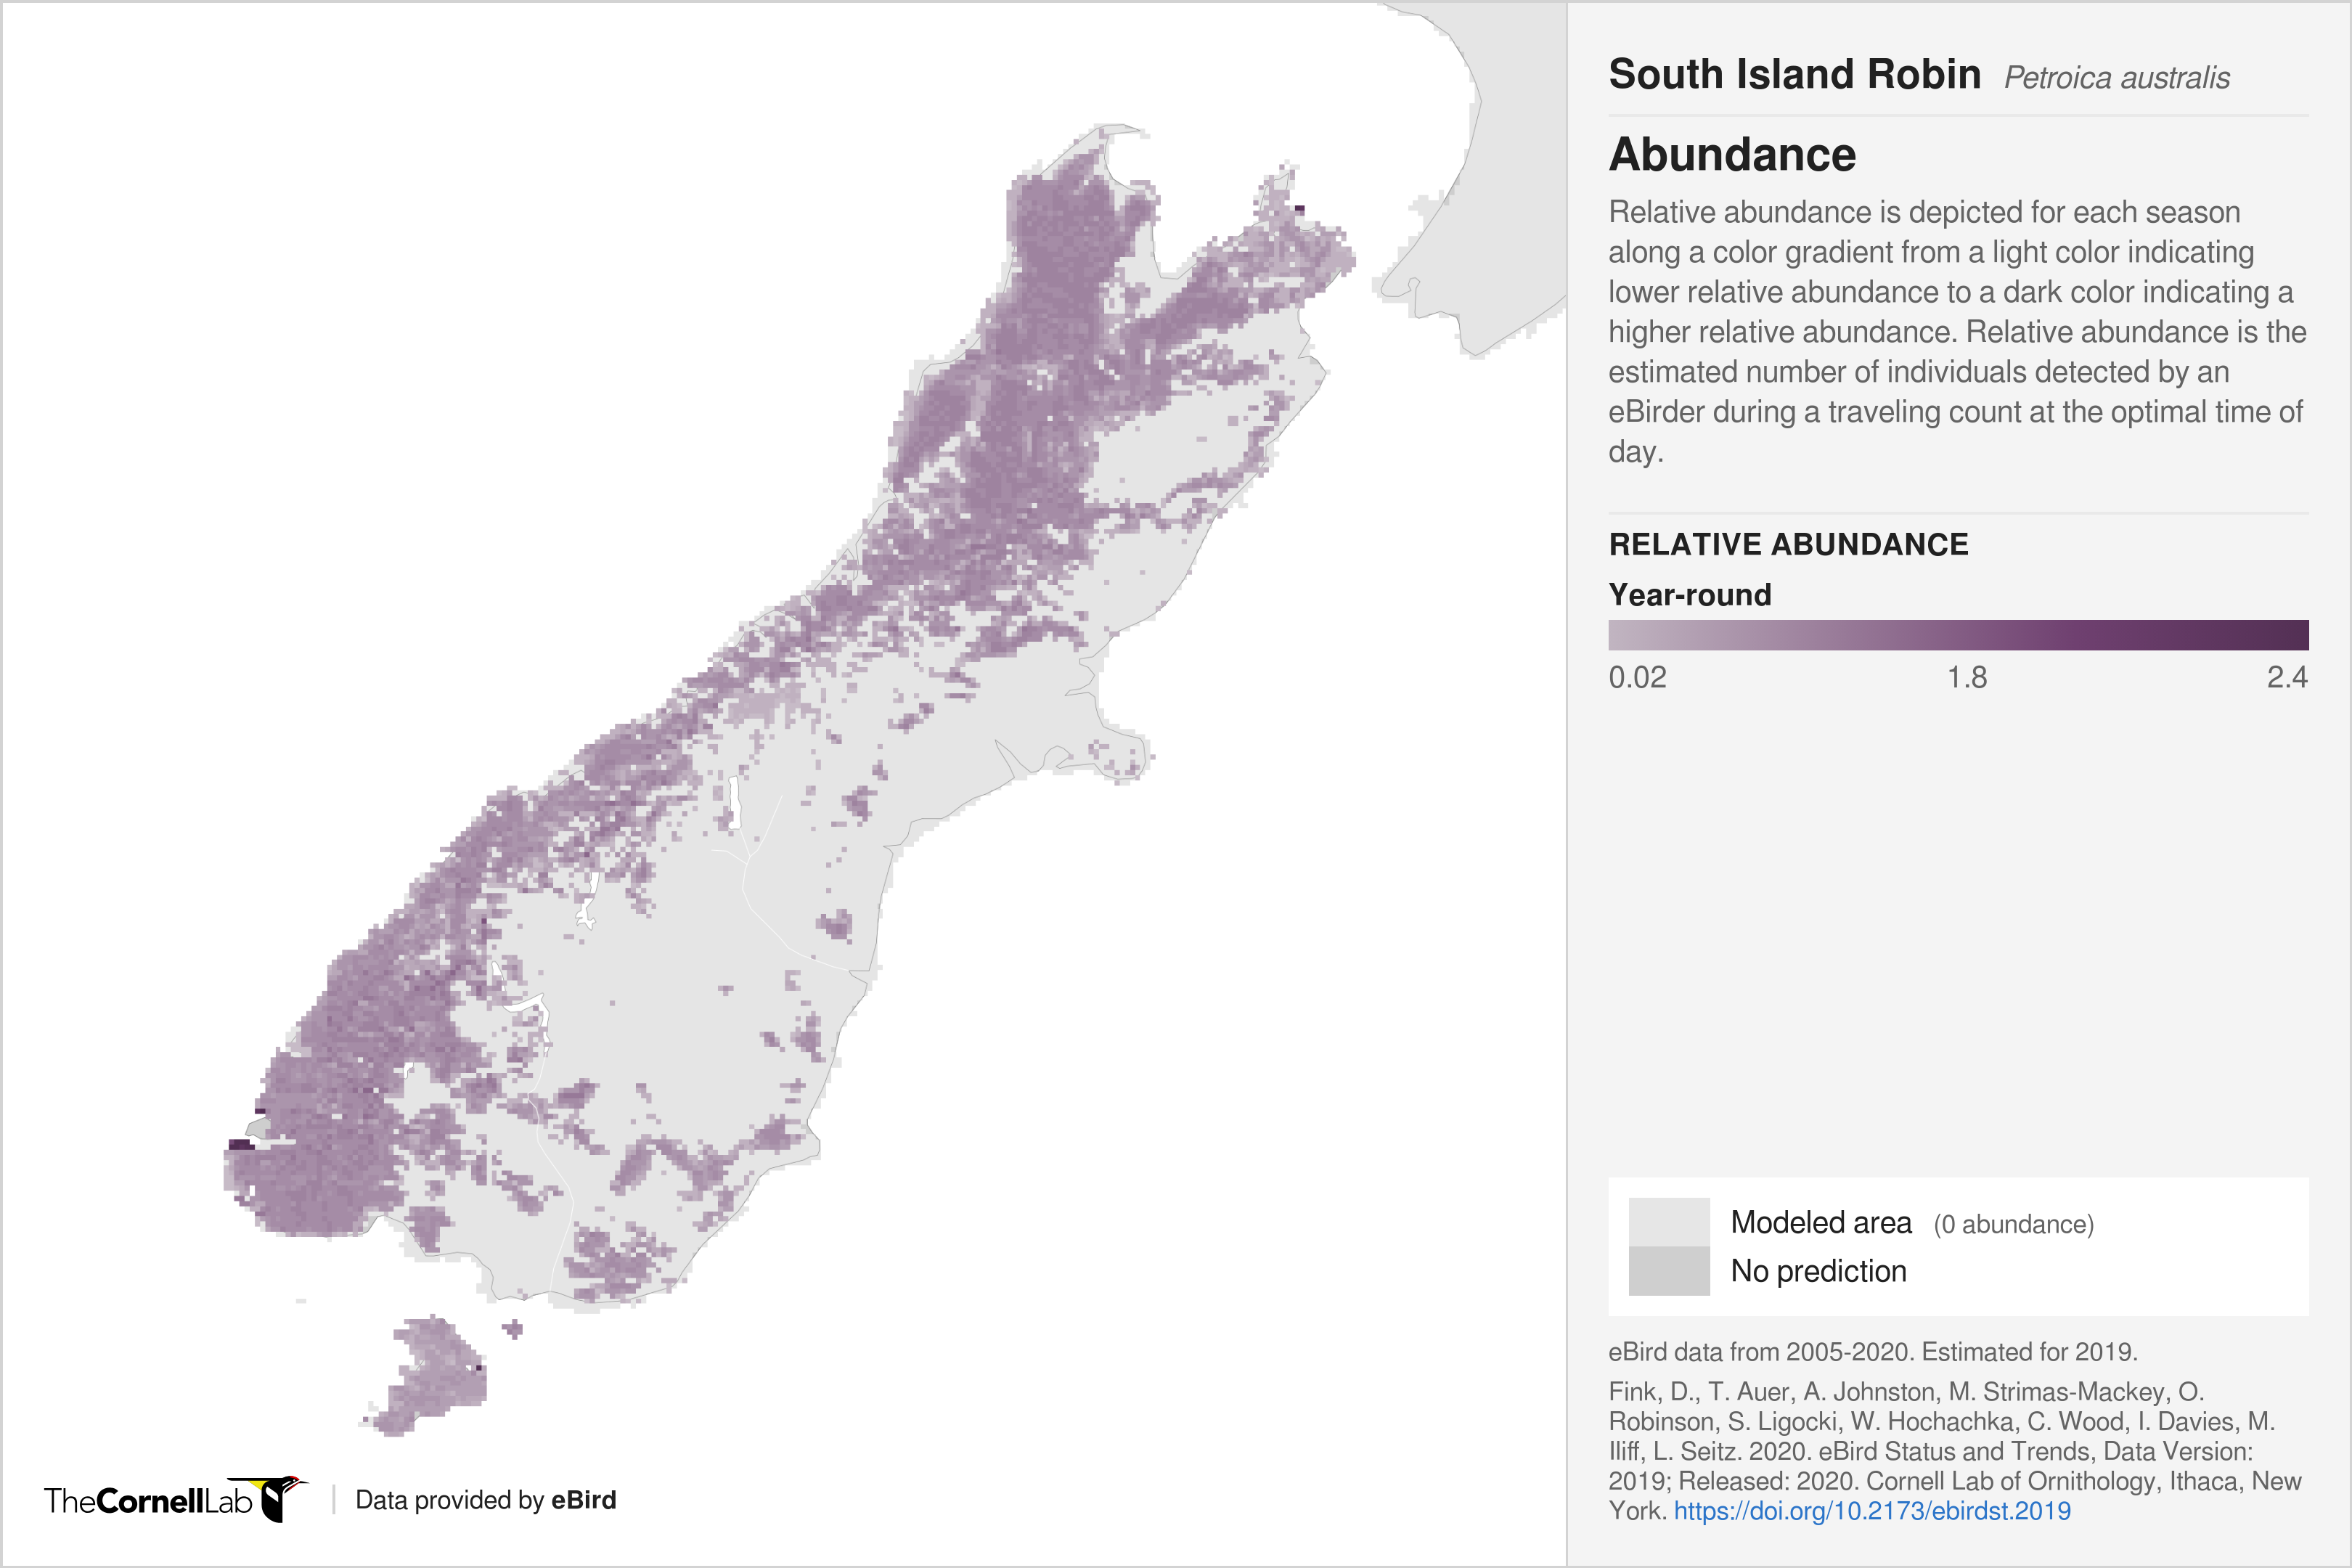
South Island Robin/kakaruwai (Petroica australis)
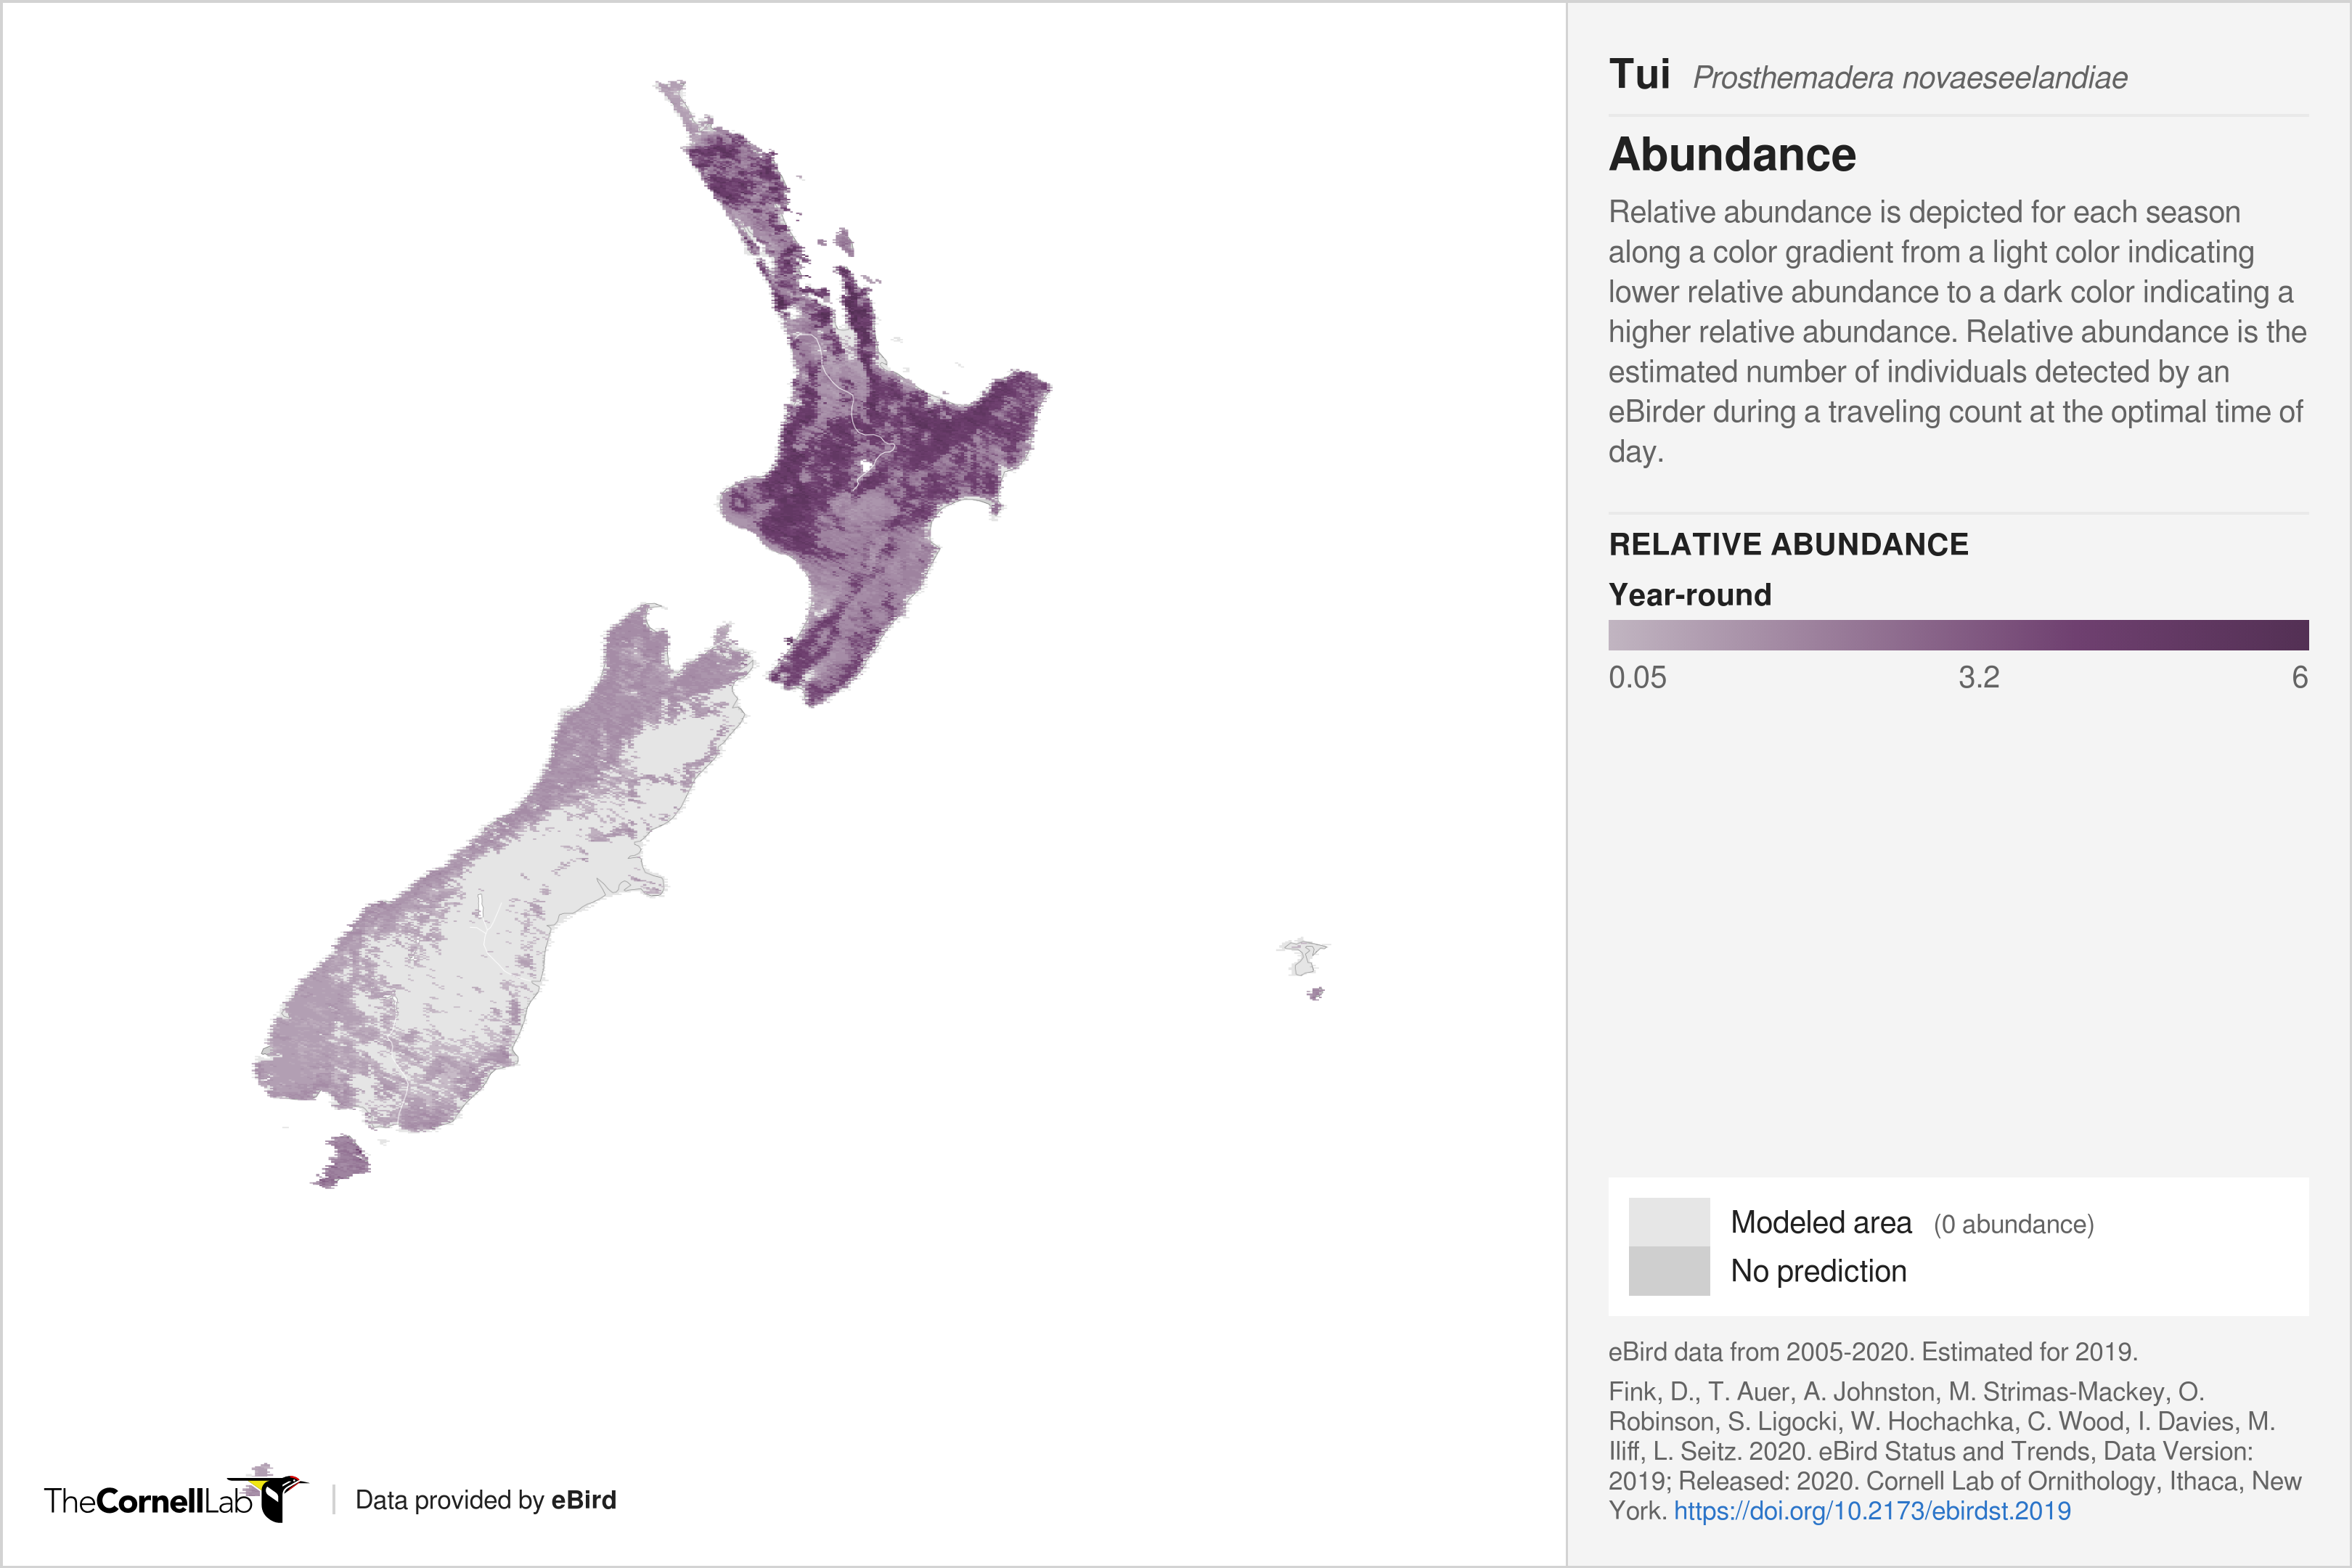
Tui (Prosthemadera novaeseelandiae)
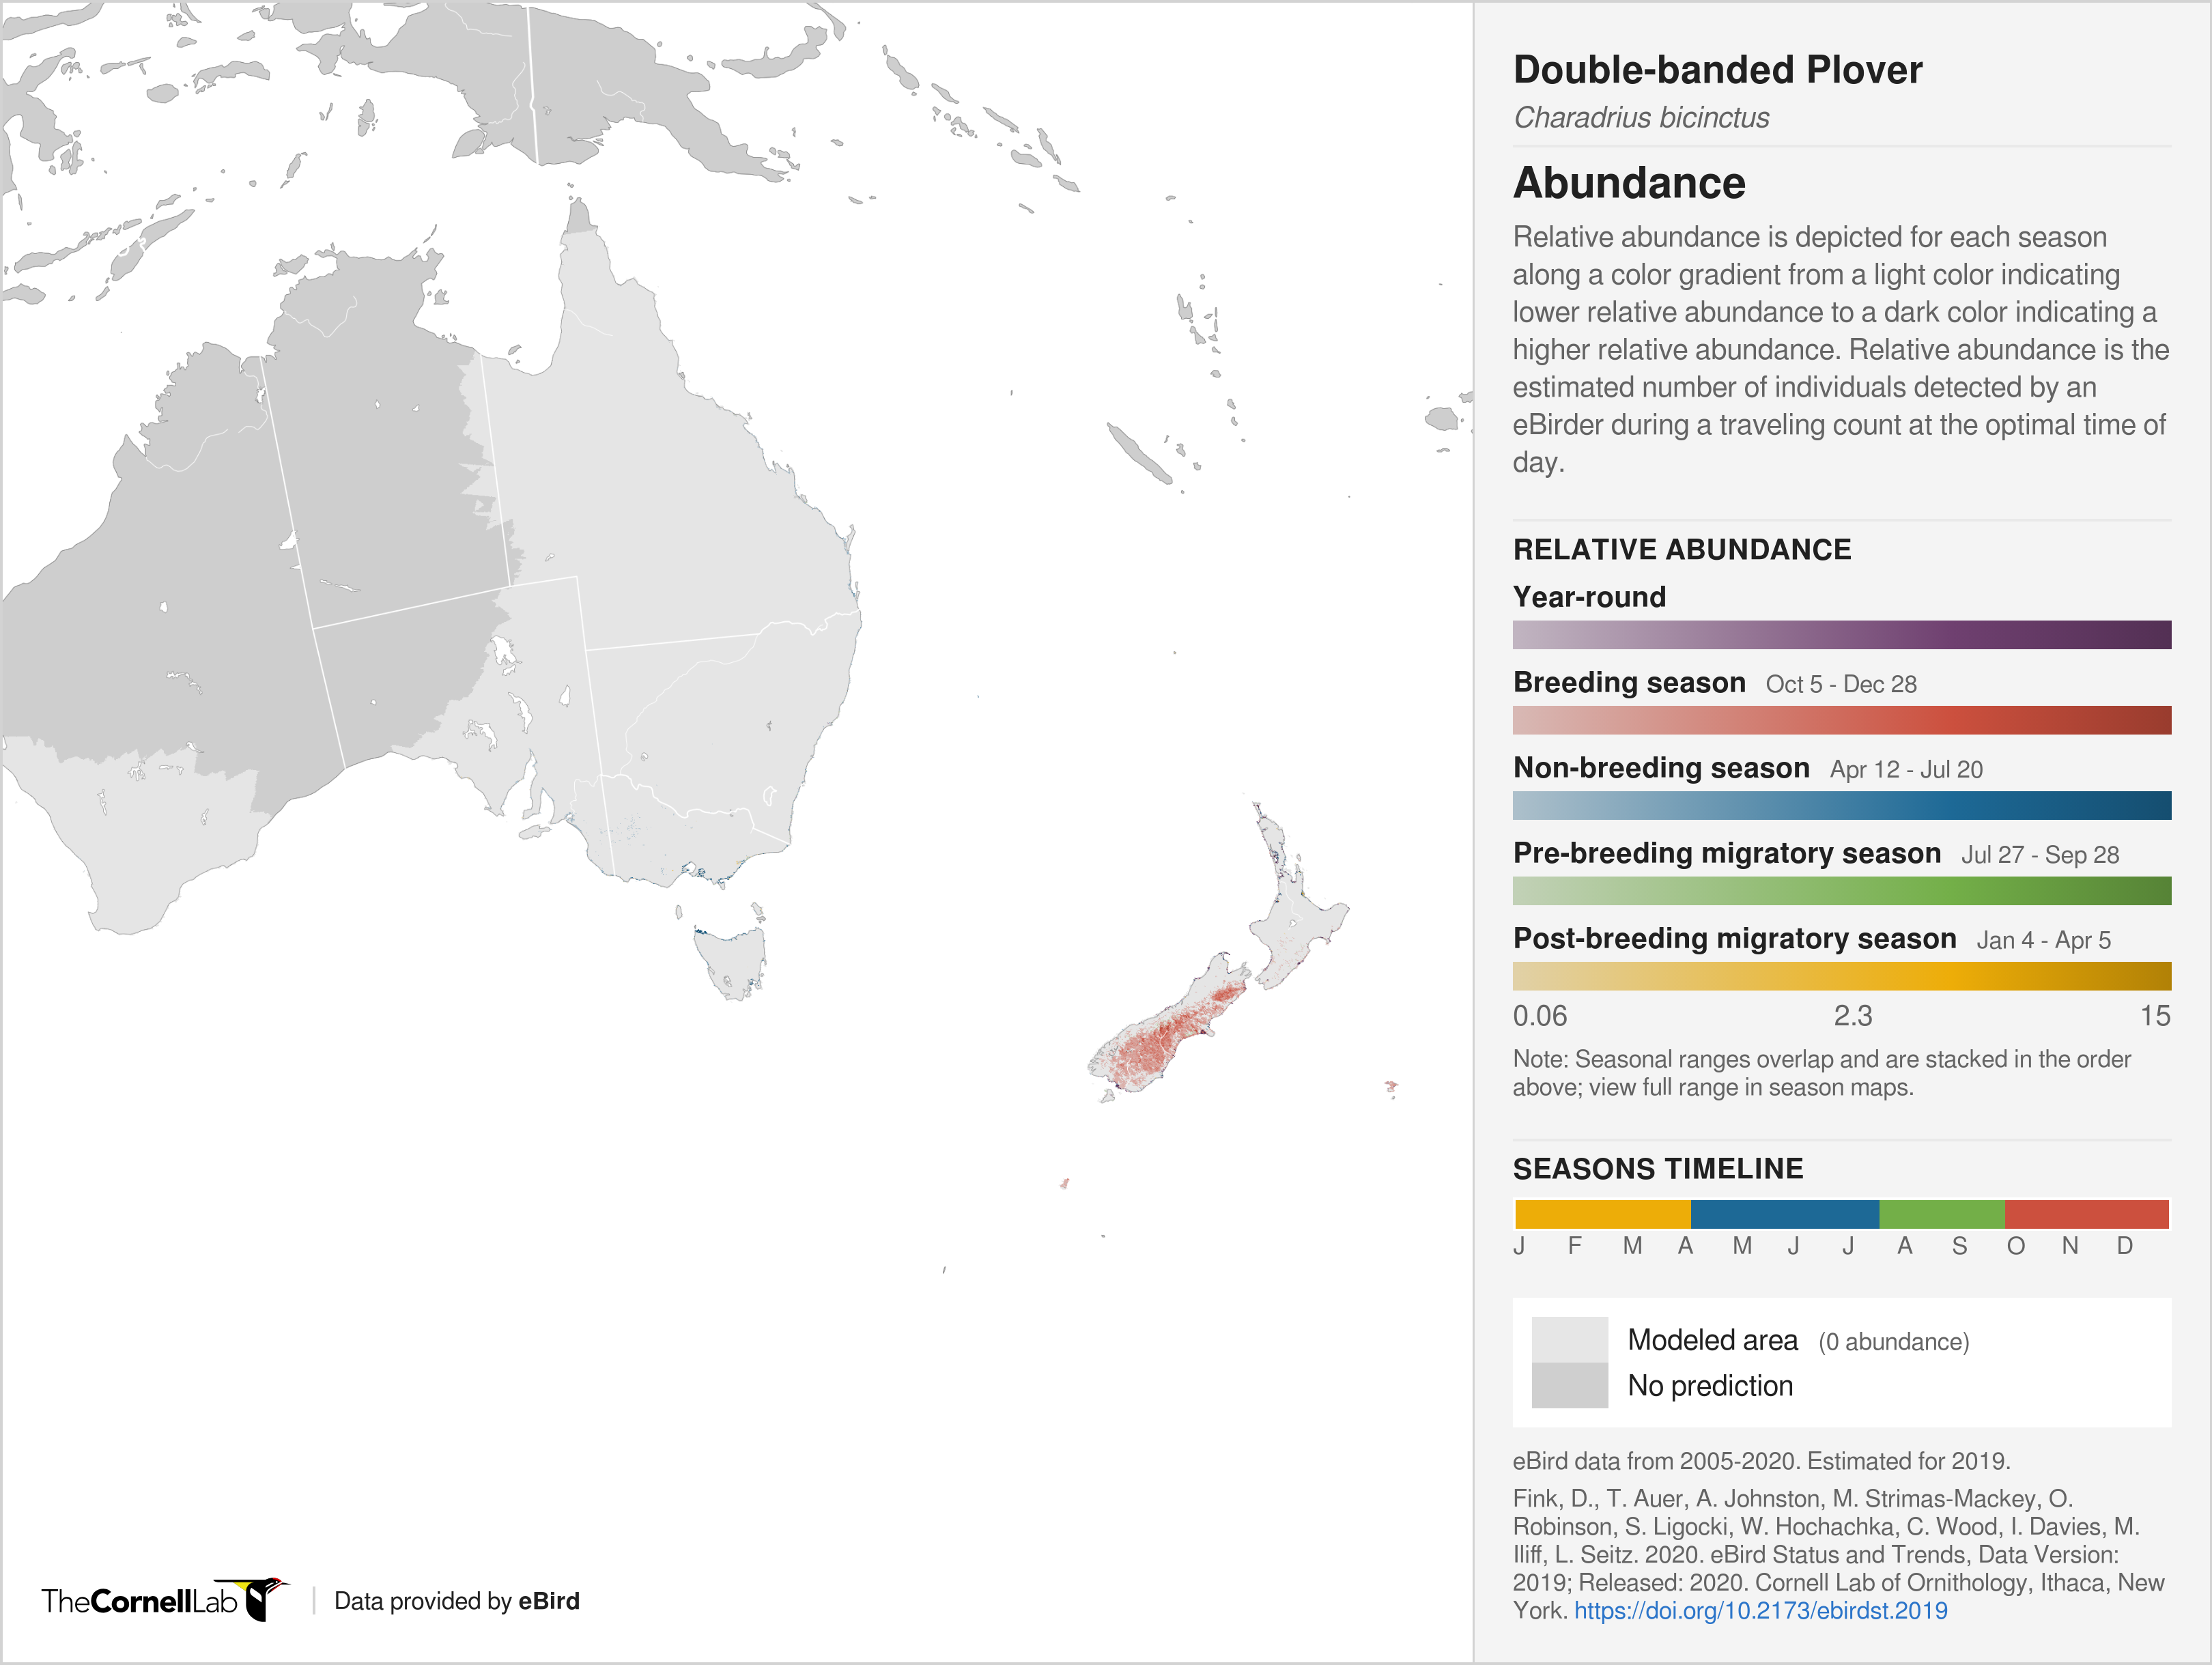
Banded Dotterel/tūturiwhatu (Charadrius bicinctus)
Wrybill/ngutuparore (Anarhynchus frontalis)
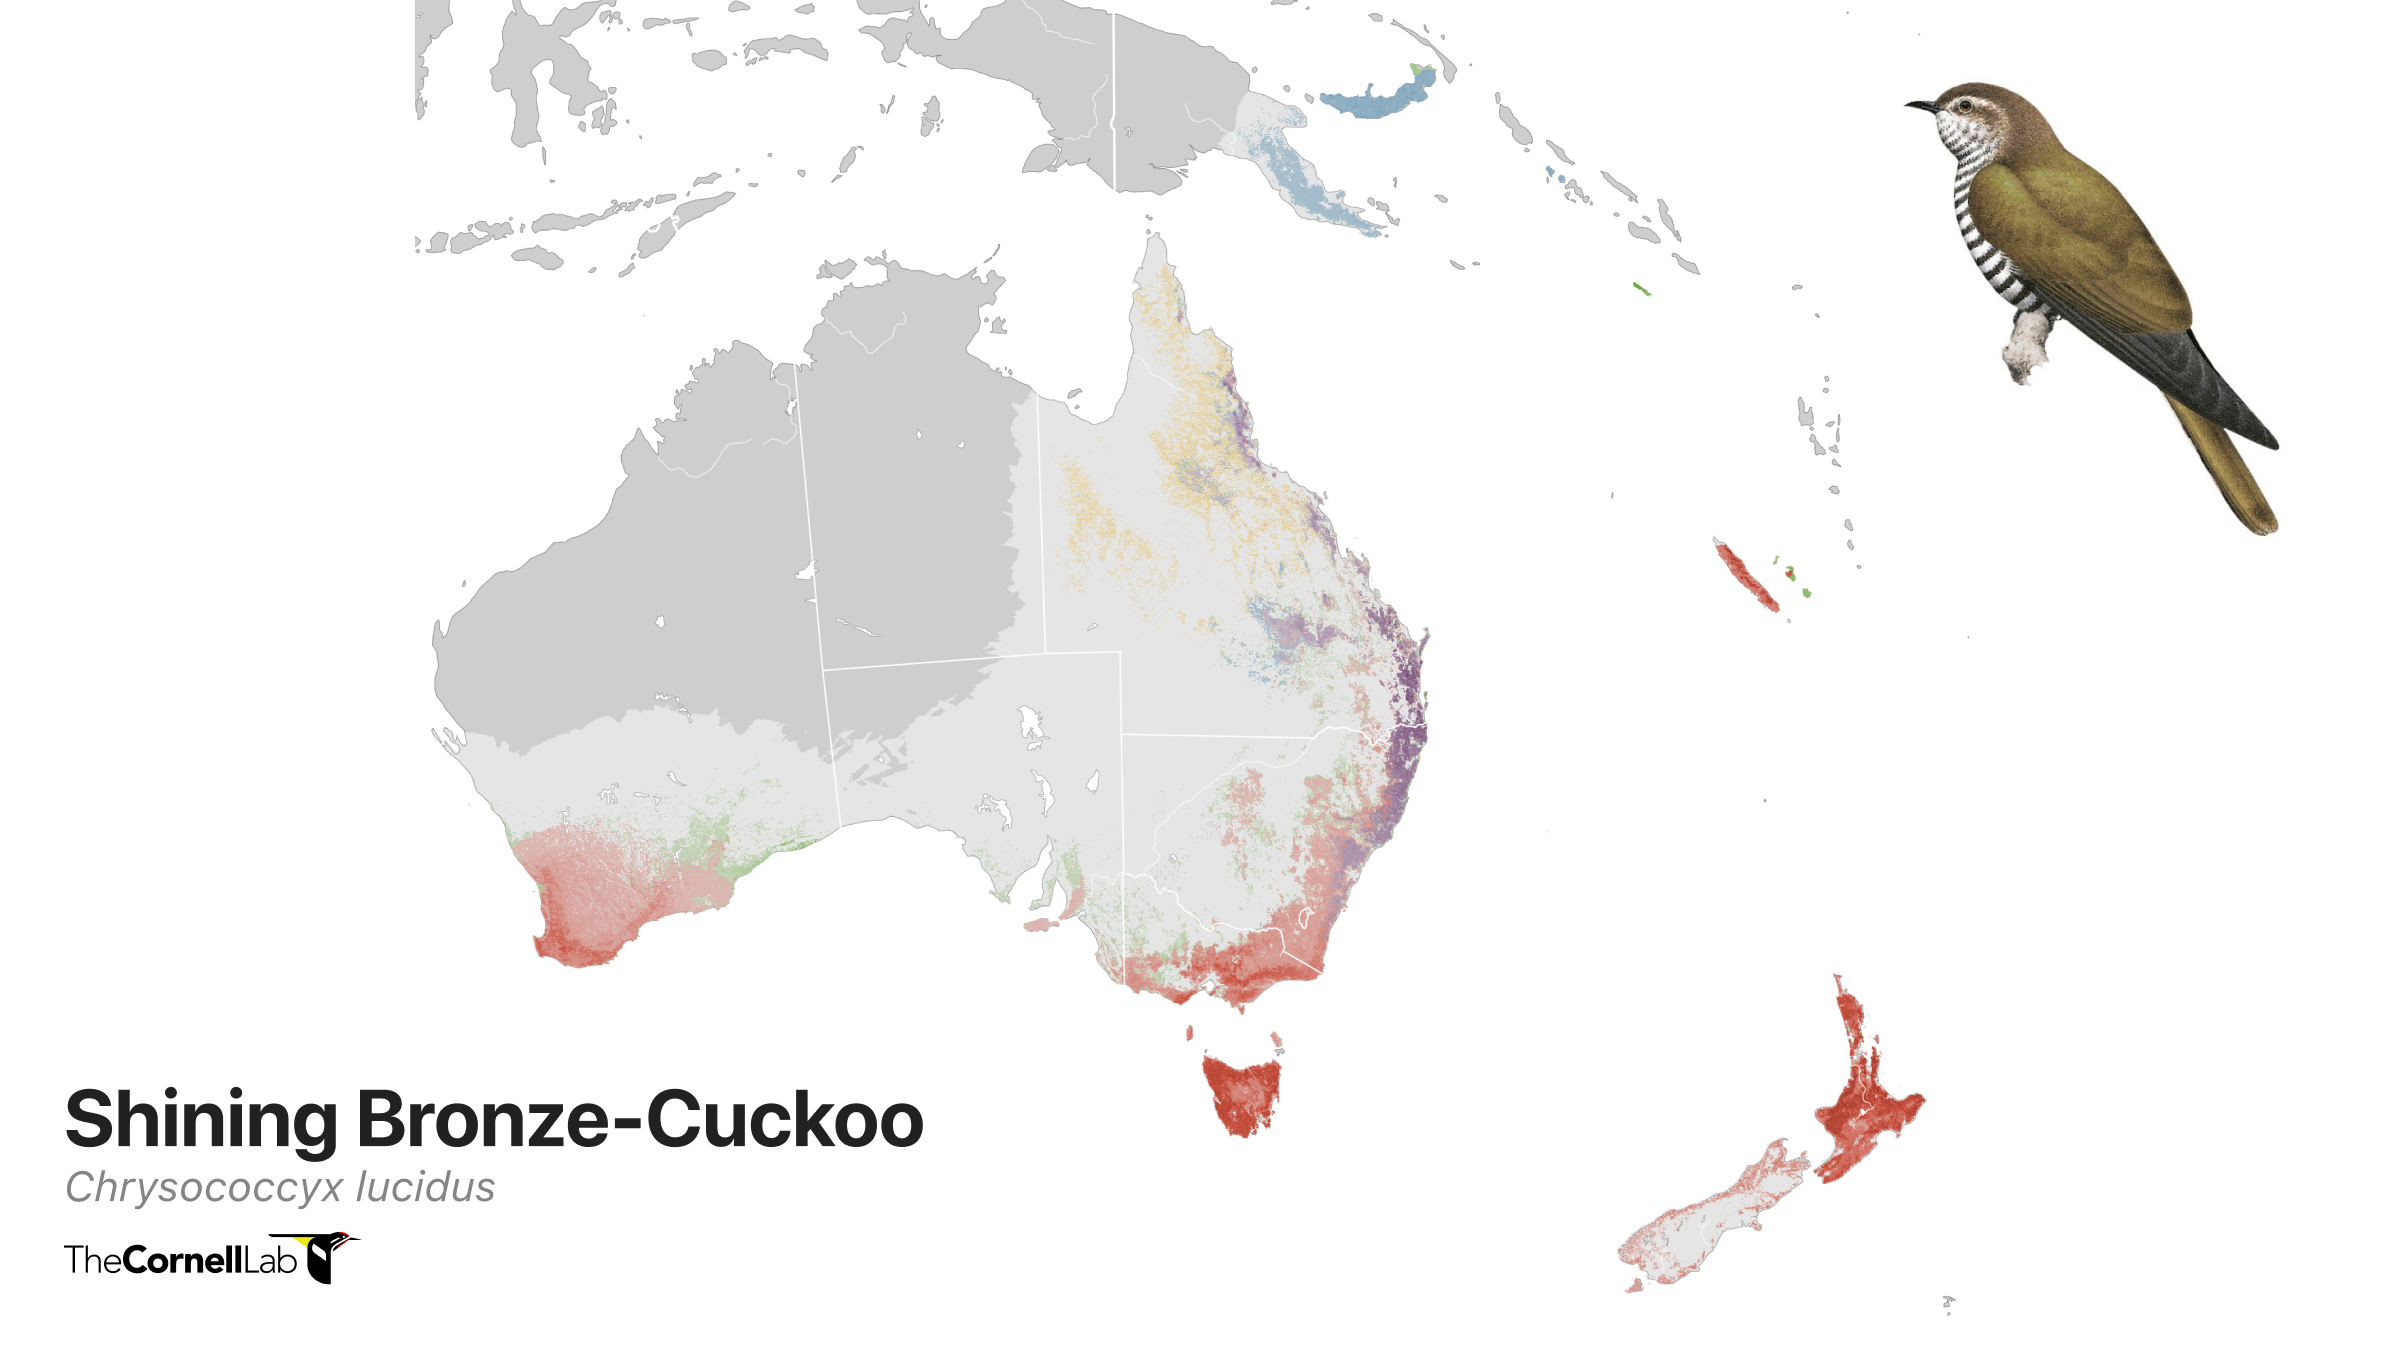
Shining Cuckoo/pipiwharauroa (Chrysococcyx lucidus)