

Brown-headed Nuthatch--one of 370 species of habitat obligate species of concern considered in the 2011 State of the Birds Report. Photo by Marshall J. Iliff.
The 2011 State of the Birds Report was released this week, featuring eBird data at its core. The same models that produce the eBird occurrence maps, created with the generous support of the Leon Levy Foundation, are a fundamental building block for the 2011 version of the most important bird conservation report in the United States. Since 2009, these reports–a collaboration between more than 15 federal, state, and NGO groups–have assessed U.S. bird populations, the threats that they face, and help determine ways we can better protect them. The 2011 report is themed “Birds on Public Lands and Waters.” eBirders everywhere can be proud that our observations are having such a tangible impact on the direct conservation of birds in the United States.
Nearly one-third of U.S. lands and all of our oceans are publicly owned. The report found that more than 300 bird species have 50% or more of their U.S. distribution on public lands and waters. Public agencies therefore have a major influence on the success of conservation efforts. The report highlights the bird stewardship opportunities for agencies including the Bureau of Land Management, Department of Defense, National Oceanographic and Atmospheric Administration (offshore waters), National Park Service, U.S. Forest Service, U.S. Fish & Wildlife Service (including all National Wildlife Refuges), and state agencies. Given the many threats facing North American birds, the fact that so much land is public holds promise that many bird populations can be maintained through a combination of adaptive management and sound monitoring.
The foreword from the 2011 State of the Birds report includes this paragraph:
“This year’s report provides the nation’s first assessment of the distribution of birds on public lands and helps public agencies identify which species have significant potential for conservation in each habitat. This assessment used high-performance computing techniques to analyze a massive data set on bird distribution from citizen-science participants across the U.S. (eBird), along with the first comprehensive database of public land ownership (Protected Areas Database of the U.S.).”
This analysis drew upon the same techniques used for the animated year-round occurrence maps that have been recently highlighted here at eBird.
To estimate the stewardship responsibility for each agency, the State of the Birds team combined U.S. bird distribution maps from eBird STEM models with a new public lands database (USGS-GAP’s Protected Areas Database of the U.S., version 1.1). The STEM models account for data biases due to time of day and effort by correcting bird occurrence for these variables, and then correct for gaps in eBird coverage by predicting occurrence evenly across the landscape by associating occurrence with landscape variables like habitat, climate, elevation, and human population density.

Fig. 1. eBird occurrence maps, like this summer Wood Thrush map, are a representation of the same occurrence data that were used to generate the 2011 State of the Birds analysis. By overlaying this predictive occurrence with the public lands database, it was possible to assess the percentage of each species’ distribution that fell on public versus non-public lands.
The analysis was limited to breeding and wintering seasons for a suite of habitat obligates of conservation concern (i.e., on the USFWS 2008 Birds of Conservation Concern and the 2007 WatchList). These models provided sufficient data for 139 species. For an additional 156 species–representing primarily waterbirds or restricted range species that do not model well with the current STEM technique–eBird was able to provide fine-scale frequency maps showing the distribution of a given species during its summer or winter range. These data were very similar to the data seen on eBird global range maps, such as this one for Black Oystercatcher. All in all, eBird data was able to provide current, vetted, and extremely accurate range information for about 300 of the 370 species selected for the report (other techniques were used for offshore waters, Alaska, Hawaii, Puerto Rico, Guam, and other Pacific Island territories). Thanks to your submissions, eBird is now being recognized as a primary authority for the most up-to-date and accurate information on bird occurrence.

Fig. 2. The USGS-GAP layer shows the ownership of the protected lands of the U.S. This layer was combined with the STEM models of eBird data in order to generate much of the information from the State of the Birds report.
The conclusions of the report are that many of the species of the highest conservation concern are already in public stewardship. With up to 90% of the distribution for Red-cockaded Woodpecker and 79% of the distribution of Gunnison Sage-Grouse on public lands, the fate of these birds is already in the hands of our country’s citizens. Now is the time to enact careful management, supported by continuous monitoring (i.e., your eBird reports). On the flip side of the coin, some other suites of birds, like grassland species, are very poorly protected by existing public land holdings. Not only has more than 97% of native grassland been lost, but just 13% of remaining grassland is publicly owned. The report highlights a need to consider grassland bird conservation in conjunction with management for livestock, since it is often the case that both livestock and bird populations would benefit from a management action such as burning or removal of woody vegetation to maintain high quality grassland.
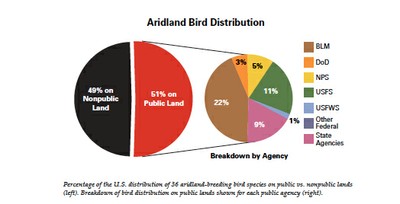
Fig. 3. The 2011 summarizes the proportion of each major habitat that is protected by non-public and public lands, and for the latter, shows a pie chart for the stewardship of each agency. The full details are available in the free report.
There is much more to be gleaned from the 48 page report, which is available at the State of the Birds website.
This year’s State of the Birds report closes with this message: “Our understanding of bird distributions has greatly improved thanks to the thousands of bird watchers who have contributed observations to eBird (www.ebird.org). This effort is especially important for tracking seasonal and fine-scale changes in bird distributions, which is not possible with other bird-monitoring programs. However, even this massive observation network provides only imperfect information for assessing the year-round status of birds on many remote public lands across the U.S., including Alaska, Hawaii, and island territories. We urge birders to submit more observations to eBird from public refuges, parks, forests, and wilderness areas. We also urge agencies to support the submission of current and historical records to eBird and other data archives.”
Those of us at eBird would like to join in thanking all of you, our eBird community, for your observations and support for the project. Together we can continue to better understand the distribution and occurrence of birds globally, and we can make sure that these data continue to be made available to those that will use it to protect the birds that we love.
The support of the Leon Levy Foundation and National Science Foundation has been instrumental to the tangible impact that eBird observations are now having on the direct conservation of birds through the State of the Birds report and other similar efforts.
