
eBird learning: new study quantifies eBirder variability and individual improvement

Ovenbird—a difficult species to detect when it isn't singing
The 272 million records in eBird come from more than 200,000 different individual birders. Each of us has a different birding style, different eBirding habits, different bird identification strengths by sight and sound, and a different focus when in the field (some of us are always looking up for raptors, while others watch for sparrows underfoot.) Some sources of variation in detection—from variation in effort, habitat, date, and time of day—are already accounted for in our analyses. However, until now our analyses have not accounted for the one of the greatest sources of variation: the birder. We recently devised a metric for quantifying differences among birders, and a newly-published paper describes the use of the method, as well as showing that with more time spent birding, as measured by the number of eBird checklists a birder enters, the more proficient they become. The paper, “Can Observation Skills of Citizen Scientists Be Estimated Using Species Accumulation Curves”, is published in PLoS ONE and available to everyone (Kelling et al. 2015).
Every one of us is constantly learning more about how to detect and identify birds, which leads to lots of variability in eBird data. Some are reporting the most conspicuous and distinctive species maybe for the first time, while others classify almost every chip note to species and proactively seek the rarer and more secretive birds every time they go afield. Even among birders with similar experience, our attention may be drawn to different groups of birds or to particular habitats. We each enjoy birds and birding in our own individual way and these differences are reflected in the checklists we report to eBird.The constant learning that thrills us as birders also creates a challenge for us as scientists. If everyone surveys for birds slightly differently, how can we accurately measure bird occurrence patterns and populations using these data?
Our team recently explored this variation in observers and described a new method to quantify and explore differences in the rates at which observers find and identify species.
We used species accumulation curves (SAC) to quantify the increase in the number of species detected with increasing search effort. SACs have traditionally been used in ecology to estimate species diversity at specific locations based on incomplete surveys. We have used the same process to estimate the number of species seen after a standardized hour of birding, creating an index specific to individual observers in a given region.

Tennessee Warbler—a tricky species to detect and identify, but knowing their songs and calls helps a lot!
The usefulness of this metric was confirmed by comparing the rates of detection of different species by observers with the highest and lowest scores for the SAC index. As expected, it was the secretive and hard-to-detect species—usually identified by ear—that showed the greatest disparity in reporting rates between the two groups of observers. The species with the most similar detection rates were consistently birds that are conspicuous, easy-to-identify, and often prevalent at feeders.
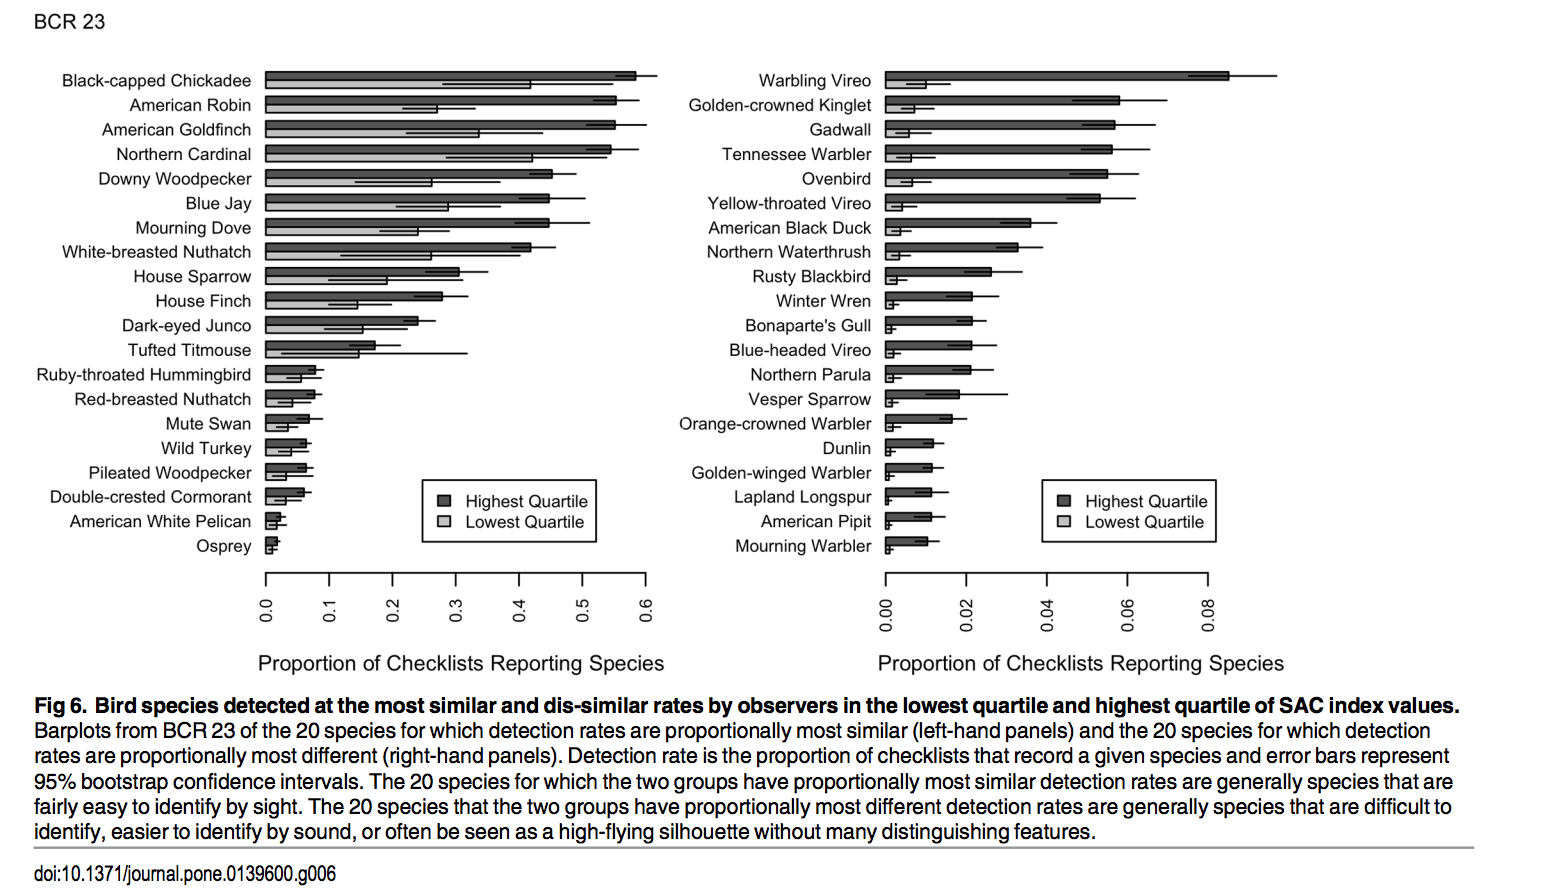
Comparison of species with the most similar and least similar (right column) reporting rates between the two groups of observers with the greatest disparity in their SACs. Click the image for a larger view.
We are excited about what we found for a number of reasons, most notably that:
- Better science will result. Every birder’s observations are valuable, and no single eBird checklist will represent a complete census of all of the birds found at a location, no matter how experienced the observer. It has always been the responsibility of someone analyzing these data to do the best possible job of accounting for species that were present but not detected (false negatives) in the checklists. This process will be improved by now allowing observer-specific corrections to account for some of the variation in detection rates and thoroughness of the lists.
- Better birders are created. The paper demonstrates individual improvement over time, indicated by more through surveys over time. In particular, birders increase their skills with practice and participation in eBird, finding more species on each checklist both by:
- More quickly detecting and identifying any species in an area;
- Especially increasing their ability to quickly locate species that are secretive, hard-to-identify, or most often detected by voice.

Species accumulation rates for observers were shown to improve over time with increased participation in eBird. Note that the X-axis should be labeled “Hours”, not “Number of Checklists”.
Download the full paper “Can Observation Skills of Citizen Scientists Be Estimated Using Species Accumulation Curves” for free from PLOS One.
This work was supported by the Leon Levy Foundation, Seaver Institute, Wolf Creek Foundation, and the National Science Foundation (IIS-1238371 and IIS-1209714).
Special thanks to everyone who has submitted data to eBird–you all helped to make this study possible. Remember, the more you submit to eBird, the better a birder you become!

Peregrine Falcon—not as difficult to detect when present