Explore birds and hotspots near you and wherever you go, all based on the latest sightings from around the world.


Explore birds and hotspots near you and wherever you go, all based on the latest sightings from around the world.
Join the world's largest birding community. Every sighting matters. Contribute yours.
What's your latest life bird? What bird lists do you care about? eBird tallies them for you and archives your photos and sounds—all for free.

Your sightings contribute to hundreds of conservation decisions and peer-reviewed papers, thousands of student projects, and help inform bird research worldwide.
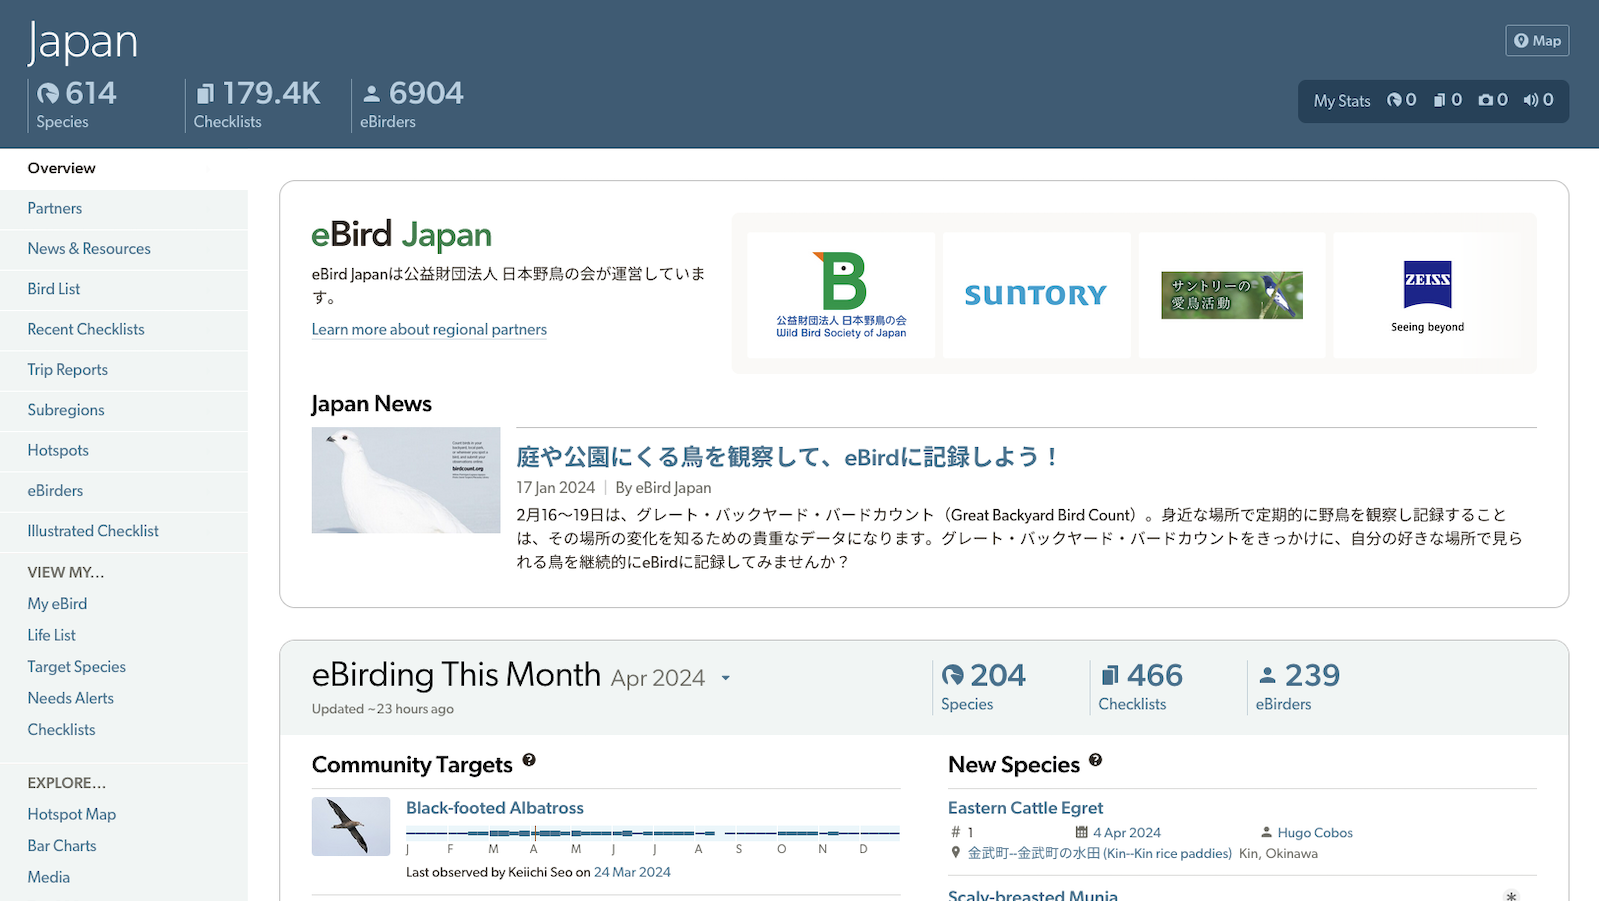
The latest improvements to the eBird website deliver personalized content and fresh features for every region in the world. Upgraded Explore Region pages deliver all the recent birding activity you crave, plus NEW sections highlighting eBirding This Month and Year, feeds of public Trip Reports for every region, and locally-relevant information curated by regional partner […]
Global Big Day is an annual celebration of the birds around you. No matter where you are, join us virtually on 11 May, help celebrate World Migratory Bird Day, and share the birds you find with eBird.
This month’s eBirder of the Month challenge, sponsored by ZEISS, will help you get to know the birds in one location. The eBirder of the Month will be drawn from eBirders who submit 20 or more eligible checklists from one location in April. By birding the same place repeatedly, you’ll gain insight into the comings and goings of birds […]
Easy data entry from the field, even when offline. All your lists and stats in your pocket. Wherever you go, eBird is there. Available in 27 languages on iOS and Android, all for free.