


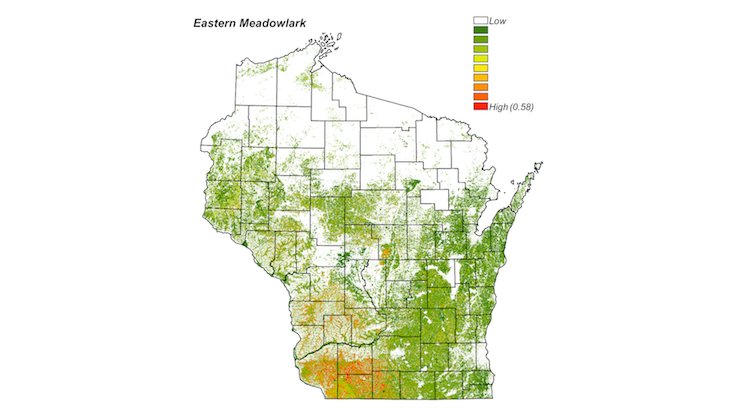
Estimated density (per 10 acres) for Eastern Meadowlarks across the state.
As part of the atlas, a small group of observers are conducting point counts. In this article we introduce this wing of the atlas effort, explain how it’s gathering critical information for conservation efforts in the state, and report on some preliminary results from 2017.
What is a point count?
Point Counts are bird surveys conducted at a single stationary location. Observers stand in one spot for a fixed period of time (in our case, 10 minutes), and record all the birds they detect. Counts are typically aimed at songbirds and conducted in early morning during the breeding season, so the majority of birds are detected by ear.
Why do point counts?
The atlas is already doing an excellent job filling out maps showing where a species occurs in the state, which is the primary goal of most atlas projects. But what the atlas doesn’t do as well is determine where within that distribution a species is most or least abundant. Adding information on relative abundance atop the information collected by general atlasing gives us the strongest picture we’ve ever had about our state’s breeding birds.
Here’s a map of Red-eyed Vireo from the first atlas conducted from 1995–2000. It looks like this species occurs across almost the entire state. But is it equally abundant everywhere within that distribution?

Here’s a map (often called a “thunderstorm map” for its resemblance to weather radar) showing the relative abundance of Red-eyed Vireo within that distribution. Clearly Red-eyed Vireo is NOT equally abundant across the state, instead appearing to be much more common in the northern forest, peaking in the northeast.

All thunderstorm maps in this article were produced by Dr. Jenny McCabe, a postdoc at UW-Madison working with Dr. Ben Zuckerberg. These maps are the result of complex models that use bird observations from point counts, and relate these data to other variables such as latitude and longitude, precipitation, temperature, time, date, and landscape factors (e.g., grassland or deciduous forest). We can then use models to predict across the state which areas are likely to have birds at certain densities. The density scale is different for each map, and can be thought of as the density per 10 acres, ranging from the red value (given in the key) to near zero (but not exactly zero) in the white areas. These are preliminary models, and as we refine our modeling techniques, we will be able to bring in additional information we collected during the point counts.
In addition, outputs from models like these can provide population size estimates for many of our breeding bird species, an important component to assessing species status.
One downside of point counts is that if a species is not very detectable during a 10-minute roadside count, it does not get well sampled. So for the most part, we will get very good information on many songbirds, but other birds will often get missed, such as species that don’t call much during daylight (Great Horned Owl, Eastern Whip-poor-will), don’t call much at all (Spruce Grouse, Virginia Rail), are uncommon breeders (LeConte’s Sparrow, Cape May Warbler), or often occur far from roads (Lincoln’s Sparrow, Acadian Flycatcher). These species will be better sampled through traditional atlasing methods that allow for more time in the field, and more off-road coverage.
How did we do it?
To accomplish the goals of our point count effort, we determined we needed to survey 5 roadside points per block in every other block across the state. That works out to over 16,000 points in more than 500 atlas blocks. And given our project timeline, we had to do it in just four years, meaning we’d need to survey 4000+ points per year!
Within each block to be surveyed, the five points were drawn randomly and moved to the nearest road, with backup points drawn in case the initial points were inaccessible. The overall plan was fairly similar to methodology used in past second bird atlases in Ontario, Pennsylvania, and Ohio.
So this year, we assembled a team of 27 trained and certified surveyors (10 Wisconsin DNR employees, 9 hired technicians, and 8 skilled volunteers) and got to work. We followed a regionally-standardized monitoring protocol (Knutson et al. 2008, Landbird Monitoring Protocol for the U.S. Fish and wildlife Service, Midwest and Northeast Regions) and recorded the distance band and minute of first detection for each individual bird.
What did we find?
We conducted 4,200 point counts statewide between May 24 and July 10, and detected 114,920 individual birds of 190 species (not all of them breeders).

The 4,200 point counts conducted in 2017 are marked in red, the ones conducted in 2016 are blue.
Here are the Top 10 Species Detected on Point Counts, the number that we detected, and how the list compared to 2016:

Obviously these are 10 very common species, but they are also species that occupy roadside habitat and are either very visible or sing often. Interestingly, 9 of 10 species in the top 10 in 2017 were the same as in 2016.
On the other hand, here is a list of species detected only once on a point count:

This list mostly contains birds that are rare breeders or difficult to detect on point counts. No White-winged Doves during the point counts this year (but one between points!)
During the planning process, we identified that certain songbirds were poorly sampled by existing surveys like the federal Breeding Bird Survey, specifically species inhabiting northern coniferous forest, and southern interior forest. For this reason, we randomly scattered an additional few hundred points into northern and southern forest habitats to try to get better information on this group of species. While results were mixed, we did boost the numbers for a few species, which should improve our understanding of their breeding abundance in the state. Here is the list of our targeted forest species, showing how many we found to date on point counts (including the regular andspecial forest points) — our current estimate is that 25 birds per year is the “magic number” as far as being able to potentially model their distribution.

This is a list of species for which we are lacking good information based on federal BBS (Breeding Bird Survey) data. Highlighted species are birds we project we will be able to model, based on numbers observed so far (in 2016 and 2017).
It will be months before we have all of the data checked and preliminary models run. Rest assured after these data are checked and compiled, they will also be dumped into atlas eBird to help fill block totals (the immense size of the dataset means it’s taking a while to review and proof!). Although the majority of records will be at the Possible code level, most point-counting mornings netted a couple incidental confirmations.
Here are a few more maps. Remember, these are very preliminary maps, and will continue to be refined as more data come in and we improve the models.
Golden-winged Warbler, a high-priority species for conservation, reaches its highest abundances in NW Wisconsin. The southern boundary at which the yellow fades to green (Chippewa to Marathon counties) coincides with the occurrence of Blue-winged Warbler, a closely related species which may be threatening the Golden-winged through hybridization.

And now let’s look at Hermit Thrush and Wood Thrush – they are both forest thrushes, so will they show similar patterns?

Hermit Thrush reaches its highest abundances in the Northern Highlands of Vilas and Oneida County, and you can see its association with piney woods on sandy soils with elevated levels in the Northwest Sands, and even reaching down to the Central Sands.

Wood Thrush shows a different pattern, being a more southern bird, it reaches its highest abundances in larger tracts of southern forests, and steadily decreases as you move north.
With 2 more years — and 8,000 points — to go, we at Atlas Central are excited to see the results of this project, which will undoubtedly shed new light on the state of Wisconsin’s breeding birds.